Chuhee Lee
At a glance
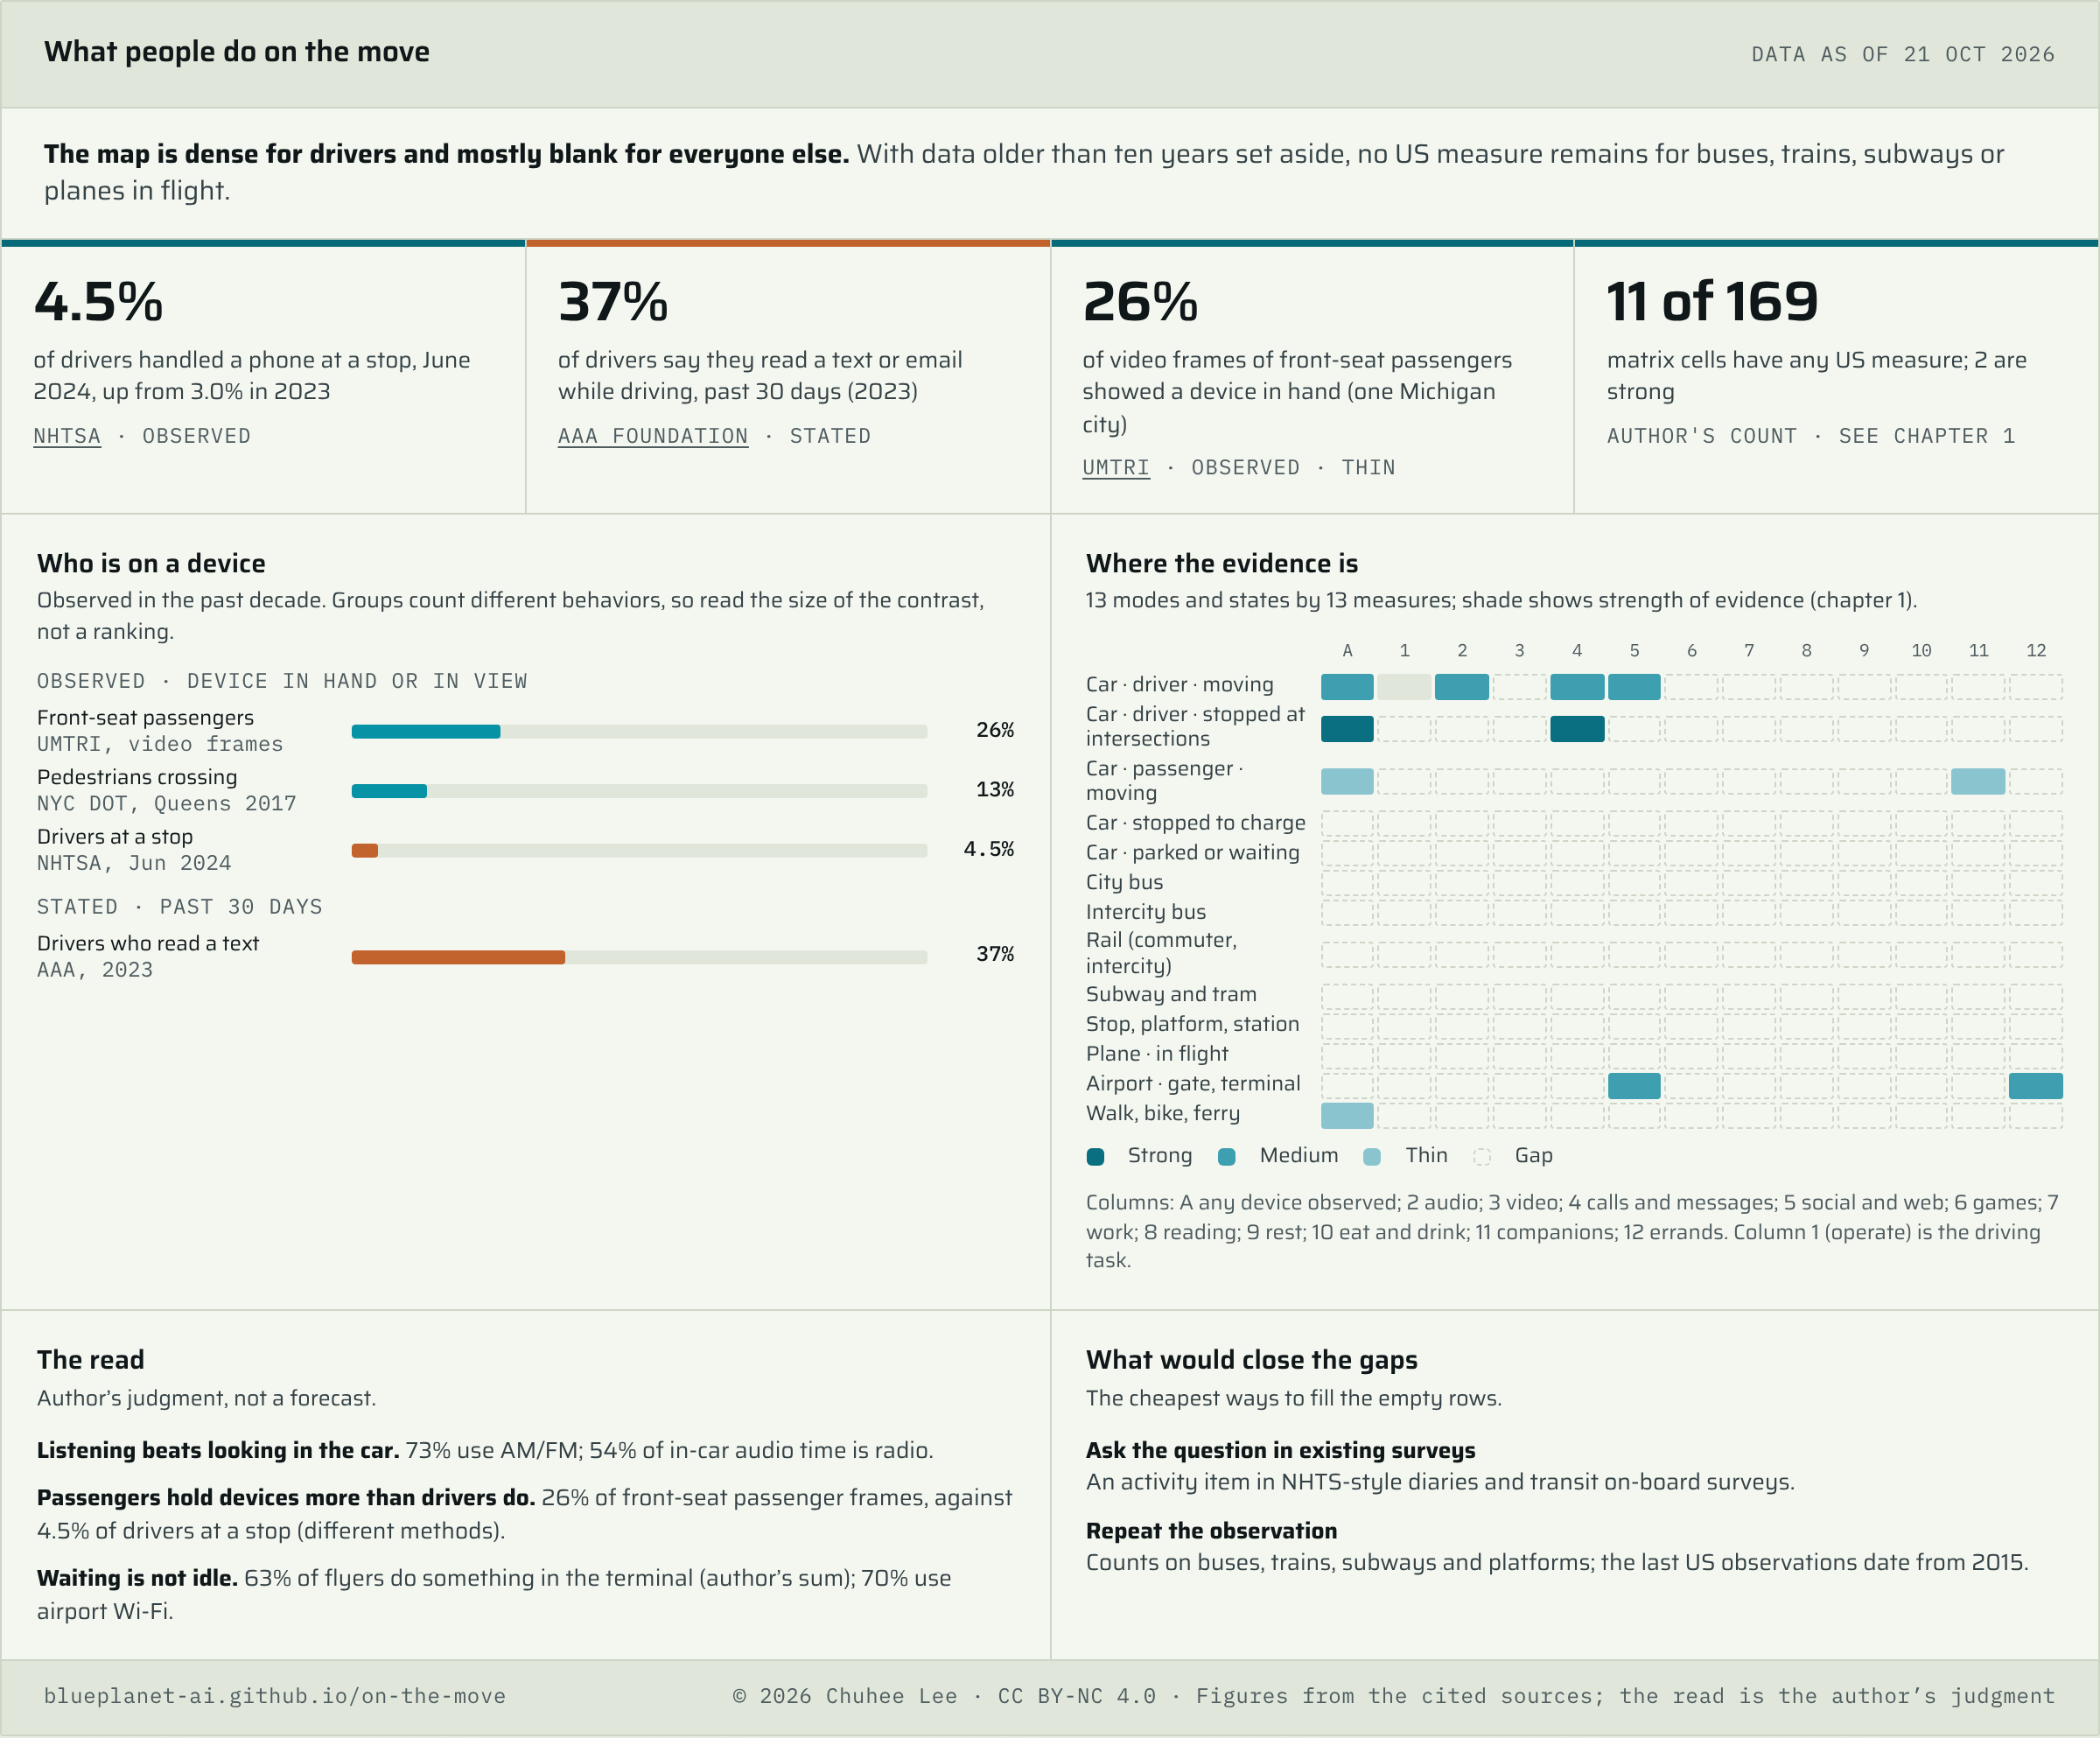
One-page summaryHeadline findingThe map of what people do on the move is dense for drivers and mostly blank for everyone else; with data older than ten years set aside, no US measure remains for buses, trains, subways or planes in flight.
Summary
The short versionThe benchmark matrix has 169 cells (13 modes and states by 13 activity measures). Only 11 have a US measurement from the last ten years, 2 are rated strong, and nearly all of them are about drivers.
Front-seat passengers hold devices more than drivers do.
A device was in hand in 26% of video frames of front-seat passengers (one Michigan city). Confidence: low; one study.[4]
Waiting is measured at airports only.
63% of flyers do something in the terminal (author’s sum) and 70% use airport Wi-Fi. Confidence: medium; one survey.[6]
Who is on a device
Observed in the last ten years · not like for like
The rows count different behaviors: a device in hand in a video frame (about four minutes each), a pedestrian looking at a device while crossing, a driver visibly handling a handheld device at a stopped vehicle, and a driver saying they did something once in a month. Read as the size of the contrast, not a ranking.[4][5][1]
What is measured, and what is not
Of 169 cells, 11 have a measure from the last ten years and 2 are strong: the map is dense for drivers and blank for most other modes.
How it is built. Rows are 13 combinations of mode and state: moving or stopped, driver or passenger, in a vehicle or waiting. Columns are an “any device” measure plus 12 activity categories (operating, audio, video, calls and messages, social and web, games, work, reading, rest, eating and drinking, companions, errands). Each cell holds the headline figure, shaded by how well it is measured.
Rating rules. Only data collected in the last ten years is used. Strong: a US-wide observation or probability sample from the last three years. Medium: a US-wide survey or dataset with a stated sample or definition; self-selected samples are flagged. Thin: a regional or small sample, or one city. Gap: nothing found. Most figures are prevalence; the only time-based figures are for driver audio and passenger video frames.
| Mode · state | Any device, observed | 1 Operate or monitor | 2 Audio | 3 Video | 4 Calls, messages | 5 Social, web | 6 Games | 7 Work | 8 Reading, learning | 9 Rest | 10 Eat, drink | 11 Companions | 12 Errands, purchases |
|---|---|---|---|---|---|---|---|---|---|---|---|---|---|
| Car · driver · moving | 53% | task | 73% | · | 36–37% | 11% | · | · | · | · | · | · | · |
| Car · driver · stopped at intersections | 4.5% | · | · | · | 1.9% | · | · | · | · | · | · | · | · |
| Car · passenger · moving | 26% | · | · | · | · | · | · | · | · | · | · | 46% | · |
| Car · stopped to charge | · | · | · | · | · | · | · | · | · | · | · | · | · |
| Car · parked or waiting | · | · | · | · | · | · | · | · | · | · | · | · | · |
| City bus | · | · | · | · | · | · | · | · | · | · | · | · | · |
| Intercity bus | · | · | · | · | · | · | · | · | · | · | · | · | · |
| Rail (commuter, intercity) | · | · | · | · | · | · | · | · | · | · | · | · | · |
| Subway and tram | · | · | · | · | · | · | · | · | · | · | · | · | · |
| Stop, platform, station | · | · | · | · | · | · | · | · | · | · | · | · | · |
| Plane · in flight | · | · | · | · | · | · | · | · | · | · | · | · | · |
| Airport · gate, terminal | · | · | · | · | · | 70% | · | · | · | · | · | · | 63% |
| Walk, bike, ferry | 13% | · | · | · | · | · | · | · | · | · | · | · | · |
Cell values are percentages of the people, trips or video frames sampled; units differ by source, so read across a row, not down a column. Sources for every cell are in the table below.
What each row rests on
| Mode · state | What the sources show | Source and sample | Rating |
|---|---|---|---|
| Car · driver · moving | 73% use AM/FM, 48% online audio, 37% podcasts; 36% held and talked on a phone and 37% read a text or email in 30 days; 11% scrolled social media; screen interaction on 52.7% of trips and 116 seconds per driving hour | Edison, 2026; AAA, 2023 and 2024; vendor telematics, 2024[10][3][9][16] | Medium |
| Car · driver · stopped | 4.5% handling a handheld device, 1.9% phone to ear, 0.5% headset; 8.7% handling among ages 16–24 | NHTSA roadside observation, June 2024, stopped vehicles only[1] | Strong |
| Car · front-seat passenger | Device in hand in 26% of video frames; conversing in about 46%. No US measure of back-seat passengers | UMTRI, 306 passengers, 2,733 trips, one Michigan city[4] | Thin |
| Airport · gate, terminal | 37% go straight to the gate, 45% go to the gate and then backtrack, 18% explore first; 70% use airport Wi-Fi | Panel of 1,200 flyers, Sep–Oct 2023[6] | Medium |
| Walking | 13% looking at a device while crossing | NYC DOT, 783 pedestrians at three Queens intersections, Nov 2017[5] | Thin |
| All other rows | No US measure from the last ten years: charging, parked or waiting, city and intercity bus, rail, subway and tram, platforms, planes in flight, bike, ferry | — | Gap |
Rare at a moment, common over a month
At a stop 4.5% of drivers handle a phone; over a month 37% say they read a message while driving; the main thing drivers do is listen to the radio.
The observed rate is low and rising. NHTSA’s roadside survey counts drivers at randomly selected intersections in daylight in June. In 2024 it found 4.5% visibly handling a handheld device, up from 3.0% in 2023 (a significant rise), and 1.9% holding a phone to the ear.[1]
The stated rate is high. In AAA’s 2023 survey 37% of drivers said they had read a text or email while driving in the past 30 days, 27% had typed one and 36% had held and talked on a phone.[3] The 2024 edition reports 37% reading and 11% scrolling social media.[9] Both can be true: they measure a moment and a month.
Moving traffic is seen only through telematics. The roadside survey sees only stopped vehicles. A 2024 telematics report finds phone-screen interaction on 52.7% of trips and 116 seconds per driving hour, about 3.2% of drive time by the author’s arithmetic, down from 134 seconds in 2022. Its drivers are enrolled in insurance programs and no driver count is given.[16] So a few percent of the time, on most trips, can sit beside 37% in a month.
Listening is the main activity. Edison’s 2026 survey finds 73% of adults who drive or ride use AM/FM, 48% online audio and 37% podcasts.[10][11] In time, AM/FM took 83% of ad-supported in-car audio in the fourth quarter of 2025, and 54% once ad-free listening is counted.[12] Phones carry 29% of in-car listeners.[17]
Audio sources used in the car
% of US adults who drove or rode in a car in the past month · Edison Infinite Dial · Jan 2026
Sources are not mutually exclusive, so shares sum to more than 100%. The base is worded as drivers and riders in the slides and as drivers in the trade report, so the passenger share cannot be separated.[10][11]
Why it matters. Audio needs neither hands nor eyes; the part of driver attention that does, handling a phone, is growing.[1]
Where the hands are free and the data are missing
Passengers, riders and people waiting are the least measured: one video study of front-seat passengers, one survey of airports, and nothing recent for buses, trains, subways or planes in flight.
Car passengers: one study. University of Michigan researchers filmed front-seat passengers in 75 vehicles, coding 13,638 frames from 2,733 trips by 306 passengers, each about four minutes of travel. A device was in hand in 26% of frames and passengers were conversing in about 46%. The drivers were volunteers in one small city and the collection year is not stated (the report is dated February 2020).[4] Private vehicles carry 87.0% of US person trips, so this is the largest block of travel time.[7]
Buses, trains, subways: nothing from the last decade. The last US observations of riders found, in Chicago from 2010 to 2015, are older than the ten-year limit and left out. Two recent agency surveys checked, NYC Ferry (2022) and four North Carolina bus systems (2022–23), ask about trip purpose and apps, not what riders do on board.[13][14]
Airports: most explore. In a 2023 panel survey of 1,200 frequent flyers, 37% went straight to the gate and 63% did something in the terminal first (the author’s sum), and 70% used airport Wi-Fi.[6] In the air, an 11-country Viasat survey has flyers saying they would use Wi-Fi for entertainment (62%) or sleep (60%); it has no US breakdown, so it is not in the matrix.[15]
Walkers: one city. A New York City DOT observer counted 13% of 783 pedestrians at three Queens intersections as looking at a device in 2017.[5] National time-use statistics do not help: the American Time Use Survey folds travel into each purpose category.[18]
What would close the gaps (the author’s suggestion). Add a “what did you do during the trip” question to travel diaries and transit on-board surveys, or repeat observation on buses, subways and platforms.
| Gap | Why it matters | What would measure it |
|---|---|---|
| Back-seat and other car passengers | Largest block of travel time; 87.0% of person trips are in private vehicles[7] | An activity question in NHTS-style diaries; in-car observation with consent |
| Bus, rail, subway, platform | Seated riders with free hands; the last observations are from 2015 | Repeat observation; activity items in agency on-board surveys |
| Plane in flight, charging, parked | Long dwell times with no US-only activity figures | Airline and charger-network data with stated definitions |
| Time share, all modes | Only driver audio and passenger video frames have time-based figures | Time-use diaries with a travel-activity module |
Method, limits and flags
Read before citingQuestion. What do people in the US do while traveling, in each mode and in motion versus stopped, and where is that behavior measured? The report builds a matrix, fills each cell from the best US source found, and rates the evidence rather than estimating the missing cells.
Scope. United States only, by choice of the author, and only data collected in the last ten years (since October 2016). Modes: car (driver and passenger, including charging and waiting), bus, rail, subway and tram, plane and airport, with walking, biking and ferries as an edge tier. It covers people’s activity, not crashes or safety outcomes.
Sources. The source type follows the claim. For how people behave, government observation and statistics, then peer-reviewed studies and agency reports, then independent panels, with vendor data as support and trade press to trace the original. Each reference carries its type and date. Observed, stated and company-claimed figures are labeled and kept apart. Searches ran on 21 October 2026 across government reports, journals, transit agency surveys and trade press, and were not a systematic review; “none found” means not found, not absent.
What this report is not. Confidence levels and the strength ratings are the author’s assessment of the evidence, not statistical measures. The “what would close the gaps” suggestions are the author’s judgment, not forecasts.
Flags and open questions
- Older data left out. Observations of Chicago-area rail riders (2010–2015), intercity bus, Amtrak and airline passengers (2014), a Fargo campus bus survey (2010), a Northern California commuter survey (fielded 2011–12), the SHRP 2 driving video (2010–2013) and a Seattle pedestrian study (2012) were found and excluded by the ten-year rule. Including them would fill several rail, bus and plane cells; that is a choice for a later edition.
- Not like for like. Observation studies count a device at a moment or in a frame; AAA counts people who ever did something in a month; Edison counts reach, and one source gives minutes. Cells are comparable along a row, not down a column.
- Roadside survey limits. NOPUS sees only stopped vehicles at intersections in daylight in June, and counts what is visible. It is not a measure of moving traffic or of crash risk.
- Passenger video study. UMTRI’s drivers were volunteers who regularly carry passengers, in one small city; 72% of passengers were women against about 62% nationally; its text gives 26% in a table and 27% in the results; “device in hand” counts holding, not necessarily using. The collection year is not stated, so it may be near the ten-year edge; the author kept it, rated thin.
- Telematics. Cambridge Mobile Telematics covers drivers enrolled in insurance programs, gives no driver or trip count in the preview read, and counts screen touches only. It is rated medium with that caveat; the 3.2% of drive time is the author’s arithmetic.
- Edison in-car figures. The slide and a trade report describe the base differently (adults who drove or rode in the past month; Americans who drive), so the audio figure sits in the driver row and cannot be split from passengers. The 83% and 54% radio time shares are ad-supported audio unless stated, relayed by trade press.
- Airport survey. A non-probability panel weighted to the census; coverage is presumed to be the US. The source text says 45% go straight to the gate while its figure shows 45% for “go to the gate, then backtrack” and 37% for straight to the gate; the figure is used. The 63% is the author’s sum.
- Viasat. Commissioned and published by Viasat, 11 countries; the US sample is 1,515 but no US-only results are published, so it is quoted in the text only. The country table on page 28 sums to 10,712 against 11,213 stated, and the report does not explain the gap.
- Pedestrians and agency surveys. The New York study covers three Queens intersections. Other pedestrian studies found were older than ten years, from a single college campus, or could not be opened. The two transit agency surveys are examples of what agencies ask, not a census of surveys.
- Scoring. The strength thresholds (three years, ten years, sample type) are the author’s choice. A different cut-off would move several cells.
Change log
- October 2026 edition
- AddedFirst edition, data as of 21 October 2026. Matrix of 13 modes and states by 13 activity measures, with US sources from the last ten years for 11 cells.
Related reports on this site
One cabin, several people sizes the passenger-hours gap that this report cannot fill with activity data. In-Car AI Assistant Benchmark covers the assistants that sit in the driver’s seat of the activities counted here.[19]
About this report
Personal research by Chuhee Lee. Research, source verification and drafting were carried out with AI models used as a research team: Claude (Anthropic), Gemini (Google) and ChatGPT (OpenAI). Every factual claim is sourced to the references listed below; topic selection, framing, ratings and conclusions are the author’s. These are personal research projects; the views are the author’s own and do not represent any employer or organization. No company named sponsors, reviews or endorses this report, and product names and trademarks belong to their owners. Licensed under CC BY-NC 4.0.
References
- [1] NHTSA — Driver Electronic Device Use in 2024 (Traffic Safety Facts Research Note, DOT HS 813 788; NOPUS roadside observation, 64,151 vehicles at 1,420 sites, 3–20 June 2024)primary (federal observation) · Apr 2026
- [2] NHTSA — Driver Electronic Device Use in 2023 (DOT HS 813 660; NOPUS: only stopped vehicles at intersections, about 7 a.m. to 6 p.m., 51,769 vehicles)primary (federal observation) · Nov 2024
- [3] AAA Foundation for Traffic Safety — 2023 Traffic Safety Culture Index, report summary (2,739 licensed US drivers, online probability panel, 1–21 Aug 2023; behaviors in the past 30 days)survey (non-profit, self-report) · Dec 2024
- [4] UMTRI (University of Michigan Transportation Research Institute) — Naturalistic Passenger Behavior: Posture and Activities, technical report UMTRI-2020-2 (in-cabin video of front-seat passengers in 75 vehicles, 306 passengers, 2,733 trips, Ann Arbor, Michigan; collection year not stated)primary (naturalistic video) · Feb 2020
- [5] NYC DOT — Distraction Shouldn’t Be Deadly (observation of 783 pedestrians at three Queens intersections, Nov 2017)city observation · 2017
- [6] National Academies — Framework and Tools for Incorporating Technologies into Airport In-Terminal Concessions Programs, Appendix B air passenger survey (1,200 panel respondents who flew at least twice in a year, Sep–Oct 2023, weighted to census)research report (non-probability panel) · 2025
- [7] FHWA — Summary of Travel Trends: 2022 National Household Travel Survey (FHWA-HPL-24-009)primary (federal statistics) · 2024
- [8] Chuhee Lee — One cabin, several people (opportunity brief; passenger-hour arithmetic, occupancy and J.D. Power passenger-screen figures as cited there; this site)own report · Oct 2026
- [9] AAA Foundation for Traffic Safety — 2024 Traffic Safety Culture Index (2,704 licensed US drivers, online probability panel, 7–27 Aug 2024; behaviors in the past 30 days)survey (non-profit, self-report) · 2024 edition
- [10] Edison Research — The Infinite Dial 2026, presentation (online survey of 2,050 people aged 12+, January 2026; in-car base: US adults 18+ who drove or rode in a car in the past month)survey (research firm; half non-probability) · Mar 2026
- [11] Radio Ink — Infinite Dial 2026: radio’s biggest audience is going digital (cross-check of the in-car figures)trade press · 2026
- [12] Radio Ink — The car remains radio’s castle in Edison’s Q4 Share of Ear (Edison Research Share of Ear, Q4 2025; Westwood One analysis)trade press (research-firm data) · 10 Mar 2026
- [13] NYC Ferry — 2022 Survey Results (about 1,600 riders, 29 Aug to 11 Sep 2022; checked for onboard activity questions, none found)transit agency survey · Jan 2023
- [14] GoTriangle, GoDurham, GoRaleigh, GoCary — Regional Onboard Survey Report 2023 (4,098 riders, Nov 2022 and Apr–May 2023; checked for onboard activity questions, none found)transit agency survey · Oct 2023
- [15] Viasat — Passenger Experience Survey 2024 (Censuswide, Aug 2024; 11,213 respondents in 11 countries, Viasat-commissioned; no US breakdown published)vendor-funded survey · 2024
- [16] Cambridge Mobile Telematics — State of US Road Risk, 6th edition preview (telematics from US drivers in usage-based insurance programs, 1 Jan 2020 to 31 Dec 2024; driver and trip counts not stated)vendor telematics · data to Dec 2024
- [17] Edison Research — In-car listening on mobile phones, Weekly Insights (US, age 13+)research firm · 26 Nov 2024
- [18] US Bureau of Labor Statistics — American Time Use Survey 2025 results (about 6,100 interviews; USDL-26-1022)primary (federal statistics) · 25 Jun 2026
- [19] Chuhee Lee — In-Car AI Assistant Benchmark, October 2026 edition (this site)own report · 11 Oct 2026