Chuhee Lee
At a glance
One-page summaryHeadline findingSpending and processing in airport terminals are well counted; what people actually do while they wait is not, and none of it is measured in Latin America or Africa.
Summary
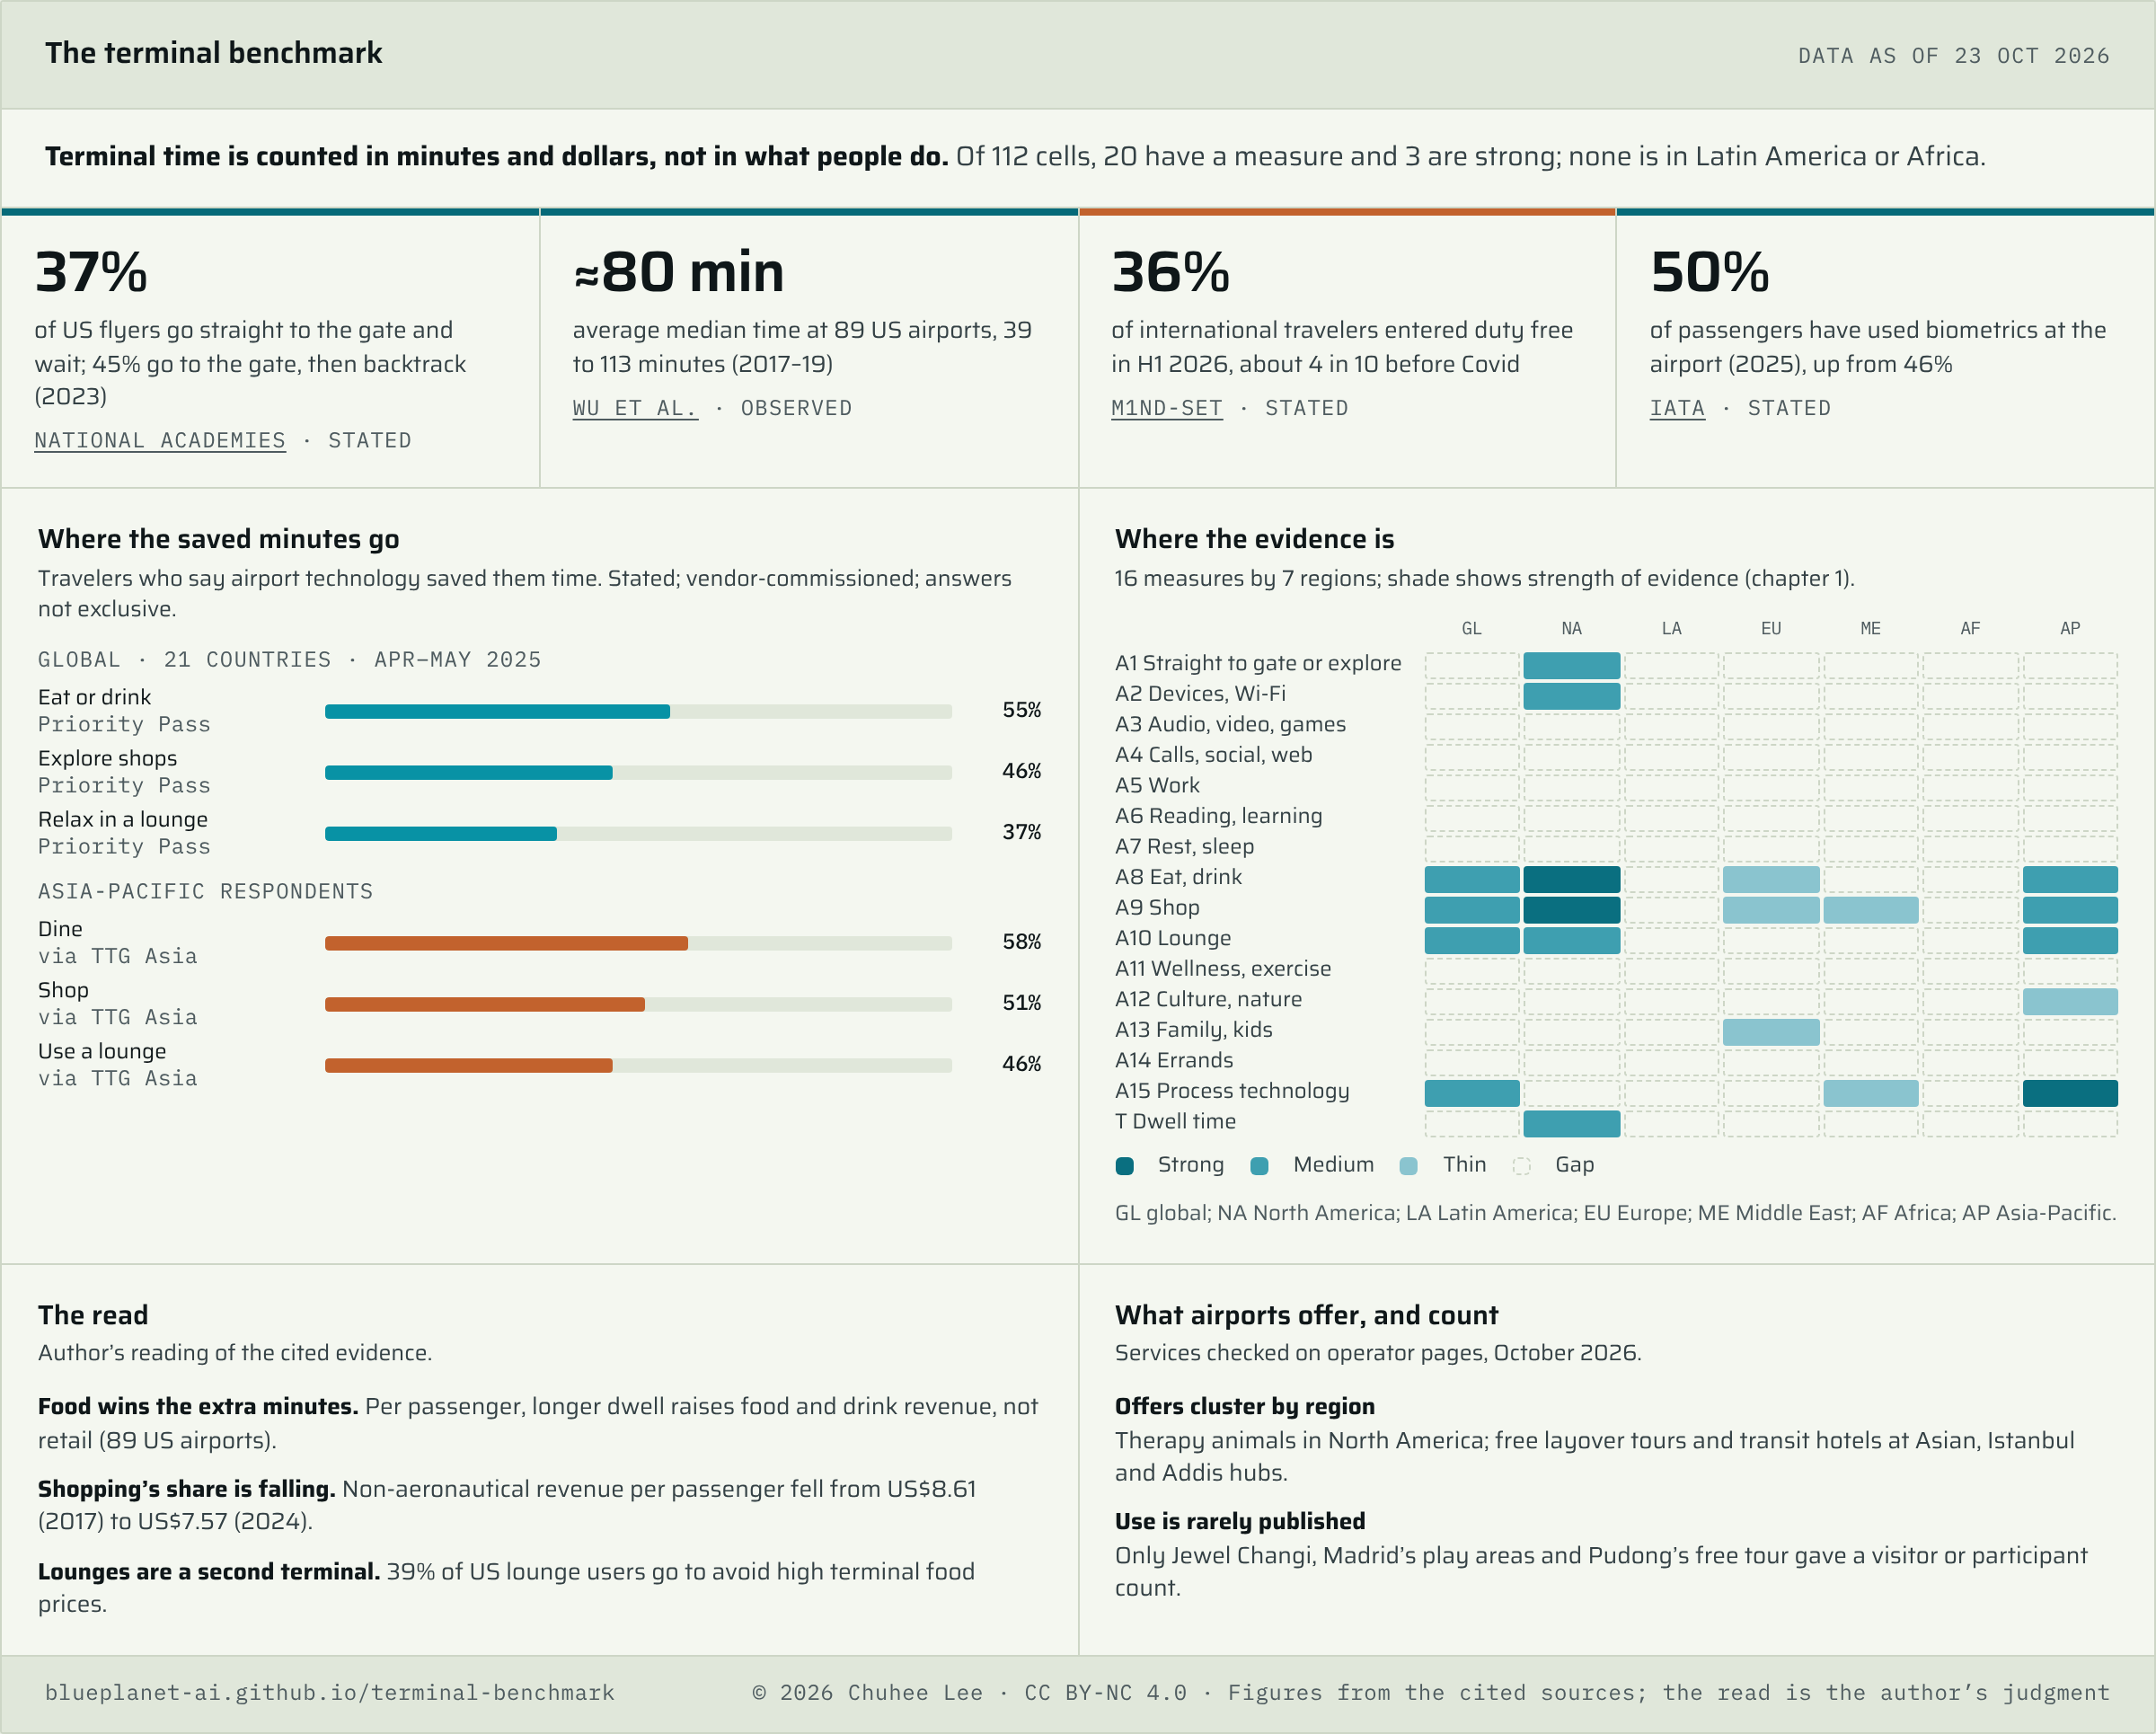
The short versionThe benchmark matrix has 112 cells (16 activity measures by 7 regions). 20 have a measure from the last ten years, 3 are rated strong, and none is in Latin America or Africa. Alongside it, 27 featured services at 20 of the 28 airports were checked on operator or official pages.
Food wins the extra minutes.
10% more dwell time goes with 8% more food and drink revenue and 6% more retail revenue, but only food rises per passenger. At Heathrow, food and drink income per passenger rose 56% from 2018 to 2025 while retail fell. Confidence: medium to high; observed revenue, US and UK only.[2][15]
Services cluster by region; use is rarely counted.
In this scan, therapy-animal programs were found only in North America, and free layover tours and in-terminal transit hotels at Asian, Turkish and Ethiopian hubs. Of the services checked, only three published a visitor or participant count. Confidence: medium on presence; gap on use.
Where the saved minutes go
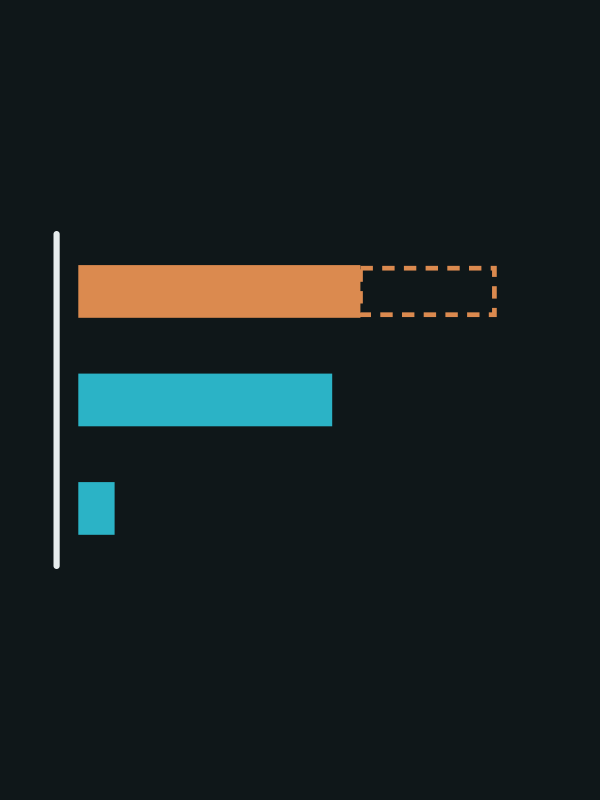
Stated · travelers who gain time from airport technology · vendor-commissioned
The base is travelers who say technology gave them extra time (45% gain 10–30 minutes); answers are not exclusive. The survey was commissioned by a lounge-access company, so read the order, not the level.[8][9]
What is measured, and what is not
Of 112 cells, 20 have a measure from the last ten years and 3 are strong. Spending and processing are counted; what people actually do while they wait is not, and two regions are blank.
How it is built. Rows are 16 measures: 14 activities passengers can do in a terminal, plus process technology and dwell time. Columns are a global column for multi-country surveys and six regions. Each cell holds the headline figure from the best source found, shaded by how well it is measured; the activity list extends the parent report’s columns to airports.[61]
Rating rules. Only data collected since October 2016 is used. Strong: observed data or a probability sample, covering many airports, from the last three years. Medium: a survey or dataset with a stated sample and definition; vendor-commissioned surveys are capped here. Thin: one airport or operator, or an unclear sample. Gap: nothing found. Spend and revenue figures stand in for eating and shopping because no source counts the activity directly.
| Activity | Global | N. America | Latin Am. | Europe | Middle East | Africa | Asia-Pacific |
|---|---|---|---|---|---|---|---|
| A1 Straight to gate or explore | · | 37/45/18 | · | · | · | · | · |
| A2 Devices, Wi-Fi | · | 70% | · | · | · | · | · |
| A3 Audio, video, games | · | · | · | · | · | · | · |
| A4 Calls, social, web | · | · | · | · | · | · | · |
| A5 Work | · | · | · | · | · | · | · |
| A6 Reading, learning | · | · | · | · | · | · | · |
| A7 Rest, sleep | · | · | · | · | · | · | · |
| A8 Eat, drink | 55% | $7.82 | · | +56% | · | · | 58% |
| A9 Shop | 36% | $4.39 | · | −21% | 21m | · | 51% |
| A10 Lounge | 73% | 39% | · | · | · | · | 80% |
| A11 Wellness, exercise | · | · | · | · | · | · | · |
| A12 Culture, nature | · | · | · | · | · | · | 80m |
| A13 Family, kids | · | · | · | 30,466 | · | · | · |
| A14 Errands | · | · | · | · | · | · | · |
| A15 Process technology | 50% | · | · | · | 9.0m | · | 100m+ |
| T Dwell time | · | ≈80 min | · | · | · | · | · |
Units differ by source (shares of people, dollars per departing passenger, counts of clearances or visits, minutes), so read along a row, not down a column. Sources for every filled row are in the table below.
What each row rests on
| Measure | What the sources show | Source and sample | Rating |
|---|---|---|---|
| A1 Straight to gate or explore | 37 / 45 / 18 split after security; 35% arrive two hours before departure | National Academies panel, 1,200 US flyers, 2023[1] | Medium (NAM) |
| A2 Devices, Wi-Fi | 70% use airport Wi-Fi | Same panel[1] | Medium (NAM) |
| A8 Eat, drink | F&B $7.82 per enplanement; +8% F&B revenue per 10% dwell; saved time used to eat (55% global, 58% Asia-Pacific); Heathrow F&B +56% per passenger | ACI-NA 79 airports; Wu et al. 89 airports; Priority Pass; Pragma[3][2][8][9][15] | Strong (NAM); Medium (Global, APAC); Thin (EUR) |
| A9 Shop | Retail $4.39 per enplanement; duty-free footfall 36%; Heathrow retail −21% per passenger vs 2019; Dubai Duty Free 21m transactions | ACI-NA; m1nd-set; Pragma; Dubai Media Office; Priority Pass APAC[3][13][15][20][9] | Strong (NAM); Medium (Global, APAC); Thin (EUR, ME) |
| A10 Lounge | 73% have ever visited; 52% of regular travelers use; 39% of US lounge users avoid terminal prices; 80% in Asia-Pacific have visited | Priority Pass; AX26; J.D. Power lounge study[8][10][5][9] | Medium (Global, NAM, APAC) |
| A12, A13 Culture, family | Jewel Changi 80m+ visits (2024); Madrid play areas 30,466 children (2019) | Operator releases[23][24] | Thin (APAC, EUR) |
| A15 Process technology | 50% have used biometrics (2025); 9.0m Smart Gate clearances in Dubai (H1 2026); 100m+ Digi Yatra journeys | IATA; GDRFA; Government of India[7][21][22] | Medium (Global); Thin (ME); Strong (APAC) |
| T Dwell time | Average of median dwell ≈80 min (2017–19); airport-reported 75–111 min by hub size (2024) | Wu et al.; ACI-NA[2][3] | Medium (NAM) |
| A3–A7, A11, A14 | No share of passengers found for media, calls, work, reading, sleep, wellness or errands in any region | Searched journals, government and operator surveys, industry and vendor research | Gap |
The gate, the food court and the lounge
Passengers spend roughly one to two hours at the airport and say they want less; the extra minutes go to food, while shopping and duty free slip and lounges absorb the premium end.
Arrival and dwell. In the US panel, 35% typically arrive two hours before departure; flyers aged 18 to 54 prefer up to 45 minutes in the terminal and older flyers an hour or more.[1] Location data for 89 US airports put the average of median dwell times at about 80 minutes, from 39 at Cleveland to 113 at Atlanta, before the pandemic.[2] Globally, 72% of passengers want to reach the gate in under 30 minutes with carry-on only, and 76% within 45 minutes with a checked bag, not counting shopping and dining.[6]
Food, not shops. A 10% rise in dwell time goes with 8% more food and drink revenue and 6% more retail revenue, but per passenger “dwell time has a significant influence solely on food and beverage”, and at airports with several concourses it has no effect at all.[2] Median sales per departing passenger in 2024 were $7.82 for food and drink and $4.39 for retail across 79 US and Canadian airports.[3] In Europe, Heathrow’s food and drink income per passenger rose 56% from 2018 to 2025 while retail per passenger fell 21% against 2019; in 2025 alone Heathrow retail per passenger rose 1.7% to £9.36.[15][16] Frankfurt’s retail revenue per passenger fell from €3.35 to €3.29, blamed on weaker shopping, and Paris spend per passenger slipped 1.2% to €31.70.[17][18]
Duty free is visited less. m1nd-set’s tracking finds 36% of international travelers entered duty free in the first half of 2026, against about four in ten before Covid; the purchase rate fell from 29% in 2016 to 22%, and conversion from 74% to 63%.[13] Globally, non-aeronautical revenue per passenger fell from US$8.61 in 2017 to US$7.57 in 2024, about 12% below 2019.[14] In Asia-Pacific and the Middle East, an ACI study finds dwell time has risen since Covid but “is not always translating into commercial engagement”.[19]
The lounge as a second terminal. 73% of travelers say they have visited a lounge or premium service at least once, and 52% of regular travelers use lounges when they travel.[8][10] In the US, 39% of lounge visitors use lounges as respite from high-priced terminal food and 45% to escape terminal crowds; 46% say their lounge is usually moderately or severely crowded.[5]
Satisfaction and spend. North American passengers who rate their airport experience “perfect” spend an average of $47.60 in the terminal, $20.22 more than those who rate it “just OK” (about $27, the author’s arithmetic); perfect journeys are 12% of the total.[4] The direction of cause is not shown.
Dwell time by airport size
Median minutes, US and Canadian airports · ACI-NA 2025 survey (calendar year 2024) · airport-reported
All respondents in each survey year, so the airports differ between years; the survey does not define where dwell time starts and ends. For comparison, phone-location data put the average of airport median dwell times at about 80 minutes for 89 US airports in 2017–2019.[3][2]
Why it matters. If extra minutes buy coffee rather than goods, the commercial case for longer dwell rests on food and lounges, and design that moves people quickly to the gate may cost little.[2]
Built for dwell, rarely counted
Leading airports compete on gardens, culture, rest and care, and the offers cluster by region; almost none say how many people use them.
What was checked. Three research inputs listed services at 28 airports chosen from the world’s busiest and best-rated, with two each added for Latin America and Africa. The services below were then checked on an operator or official page in October 2026; anything that could not be confirmed as operating, such as Rijksmuseum Schiphol and the Istanbul Airport Museum, is left out.
Regional patterns. In this scan, therapy-animal programs were found only at North American airports. Free city tours and free transit hotels sit at transfer hubs in Asia, Istanbul and Addis Ababa, where they double as airline marketing. Paid sleep cabins and in-terminal hotels were verified at six airports outside North America: Bogotá, Istanbul, Madrid, Paris, Addis Ababa and Shanghai. Sensory and quiet rooms are spreading fast: Hong Kong opened its Sensory Corner in April 2026 and Helsinki its quiet room in November 2025.[44][50]
Where verified examples sit
| Service type | N. America | Latin Am. | Europe | Middle East | Africa | Asia-Pacific |
|---|---|---|---|---|---|---|
| Therapy animals | DEN, LAX, SFO | · | · | · | · | · |
| Free layover tours or transit hotels | · | · | IST | · | ADD | SIN, ICN, PVG, HKG |
| Paid sleep cabins or in-terminal hotels | · | BOG | IST, MAD, CDG | · | ADD | PVG |
| Sensory or quiet rooms | SFO, YVR | · | HEL, LHR (sensory packs) | · | · | HKG |
| Nature, culture and play showpieces | YVR, DEN | · | AMS, CDG, MUC | DOH, DXB | · | SIN, ICN, KUL |
Only services checked on an operator or official page in October 2026 are shown, so an empty cell means none was verified, not that none exists. No featured service was verified at Atlanta, Dallas/Fort Worth, Chicago O’Hare, Mexico City, Riyadh, Cape Town, Tokyo Haneda or Delhi.
Featured services
| Airport | Service | What it is | Access |
|---|---|---|---|
| SIN | Butterfly Garden | Over 1,000 tropical butterflies of up to 40 species, with a 6 m waterfall, in the Terminal 3 transit area, open 24 hours[27] | Airside; free |
| SIN | Free Singapore Tour | 2.5-hour guided city tours for transit passengers with a 5.5 to 24 hour layover; booths in the T2 and T3 transit halls[28] | Free |
| DOH | ORCHARD | 6,000 m² indoor tropical garden with more than 300 trees in Concourse C; a free wellness studio ran there as a pilot from 6 September to 25 October 2026[29] | Airside; free |
| AMS | Airport Park | Indoor park above the D-pier with a 130-year-old tree, birdsong and exercise bikes that charge phones[30] | Airside |
| YVR | International Creek and Aquarium | 114,000-litre aquarium with more than 5,000 creatures native to British Columbia, in International Departures[32] | Airside |
| KUL | RIMBA | 970 m² nature-themed transit zone in the Terminal 1 Satellite Building, launched 13 January 2026 on the former Jungle Boardwalk[34] | Airside |
| CDG | Espace Musées | Free museum in Terminal 2E Hall M; the 2026 show, Paris-Rome with Paris Musées, runs to 5 January 2027[35] | Airside; free |
| ICN | Korea Traditional Culture Experience Center | Free traditional music performances four times a day near Gate 29 in Terminal 1[37] | Free |
| ICN | Transit tours | City tours for transit passengers with a layover of 24 hours or less; registration desks after immigration in T1 and T2, seats first come, first served[38] | Free tours |
| IST | iGA Sleepod | 44 sleeping cabins near the international D gates, from €12 to €24 an hour depending on time of day[39] | Airside; paid |
| IST | Touristanbul | Free city tours for international transit passengers with a 6 to 24 hour layover; a free hotel for 20 hours or more on round trips[40] | Free (Turkish Airlines) |
| PVG | Rest cabins and free showers | 30 rest cabins built in 2025 (13 open in July), ¥35 per half hour to ¥299 for eight hours; 11 free shower rooms for transit passengers[41] | Airside; cabins paid |
| PVG | Free layover tour | Trip.com tour for passengers with an 8-hour-plus layover, up to 10 people per tour; about 3,000 international passengers in its first five months[42][25] | Free |
| HKG | Free layover tours | Three free four-hour city tours for transit passengers with a layover of more than 7 hours[43] | Free |
| HKG | Sensory Corner | Calming space on the Terminal 1 departures level, restricted area, opened 1 April 2026; 05:00 to midnight[44] | Airside; free |
| MAD | Gettsleep Lounge and Air Rooms | Gettsleep: 32 rest modules in the T4S boarding area (December 2025). Air Rooms: 22 cabins with showers in T4, open 24 hours[45][46] | Paid |
| ADD | Skylight In-Terminal Hotel | 97-room hotel in Terminal 2; Ethiopian passengers with an 8 to 24 hour connection get a free room, meals and transfers[47] | Paid, or free on eligible connections |
| CDG | YOTELAIR | Cabin hotel in the secure transit area of Terminal 2E, above Gate L[36] | Airside; paid |
| BOG | Wait n’ Rest and Sleep Oasis | Self-check-in rest rooms on international Pier A and pods in the public hall, both open 24 hours, charged by the hour[48] | Paid |
| HEL | Quiet room and Maja Living Room | Quiet room near Gate 32, open to all (November 2025); Maja near Gate 52 with a silent room, yoga room and wall bars[49][50] | Airside |
| LHR | Sunflower lanyards and Flight Ready | Free lanyards and sensory packs at assistance desks; four-hour Terminal 5 familiarization tours for autistic and neurodivergent people, by ballot[51] | Free |
| SFO | Yoga rooms, Sensory Room, Wag Brigade | Three free yoga rooms, a post-security sensory room in Terminal 1 and therapy animals since 2013[53] | Airside; free |
| DEN | CATS and outdoor decks | More than 140 registered therapy animals; three post-security decks with fire pits near A15, B7 and C67, open 06:00 to 22:00[54][55] | Airside; free |
| LAX | PUP therapy dogs | Volunteer dogs and handlers in gate areas; over 80 dogs in May 2025[56][57] | Airside; free |
| YVR | Quiet spaces | Low-stimulation rooms after security near Gates B28/C40, D67, D71 and E85[33] | Airside; free |
| MUC | Airbräu and winter market | On-site brewery since 1999, open daily; Christmas and winter market with an ice rink, 13 November to 27 December 2026[58][59] | Landside; paid |
| DXB | Game Space | “The region’s first airport gaming lounge”, Terminal 3 B gates, open 24/7[60] | Airside |
The usage gap
Every usage-type figure found for a service at the 28 airports is below. Most are counts of what is provided, not of who uses it.
| Service | Figure | What it counts |
|---|---|---|
| Jewel Changi (SIN) | Over 80 million visits in 2024, overseas travelers just over a third[23] | Visits (most not overseas travelers) |
| Free layover tour (PVG) | About 3,000 international passengers from April to September 2024[25] | Participants |
| Children’s play areas (MAD) | 30,466 children in 2019[24] | Users (pre-pandemic) |
| CATS (DEN) | More than 140 registered animals[54] | Capacity, not use |
| PUP (LAX) | Over 80 dogs, May 2025[57] | Capacity, not use |
| Duty-free online orders (DXB) | 2.65% of 2025 Dubai Duty Free sales[20] | Share of sales |
Faster processing is mainstream; what the saved time buys is not shown
Half of passengers have used biometrics and government counts run into the millions, but the claim that saved minutes turn into spending rests on what passengers say.
Adoption. 50% of passengers have used biometrics somewhere in their airport journey, up from 46% in 2024, most often at security (44%); 85% of users are happy with it.[7][6] SITA finds that “nearly 7 in 10” travelers are comfortable with biometric scanning.[12]
Counts. Dubai airports cleared 9,024,736 passengers through Smart Gates and 439,321 through the Red Carpet corridor in the first half of 2026.[21] India’s Digi Yatra has handled over 100 million journeys across 38 airports; the government says entry checks fell from 15 to 5 seconds, a claim not independently measured.[22]
Booking ahead. Schiphol lets departing passengers book a free security time slot up to three days ahead.[31] Heathrow’s free Reserve & Collect lets passengers reserve goods in most shops and pay on collection.[52] Denver ran a reservable security lane as a pilot in 2023; its current status was not confirmed.
Does saved time become spend? 45% of travelers say technology saves them 10–30 minutes and 60% say it makes them spend more at the airport.[8] No observed study linking faster processing to higher spend was found.
Biometrics at the airport
% of passengers · global surveys
Use and willingness are different questions in different samples. The ACI survey was supported by a biometrics supplier, among others.[6][7][11]
Why it matters. If processing keeps getting faster while spend per passenger falls, the freed minutes are going somewhere other than shops: the gate, the lounge or the phone.[14]
Method, limits and flags
Read before citingQuestion. What do people do in airport terminals around the world, what do airports offer for that time, and how much of it is measured? The report builds a matrix of activities by region, fills each cell from the best source found, rates the evidence rather than estimating missing cells, and benchmarks services at 28 airports.
Scope. Global, tagged by region (North America, Latin America, Europe, Middle East, Africa, Asia-Pacific), with a global column for multi-country surveys. Statistics use data collected since October 2016; services had to be operating, confirmed in 2025 or 2026. The 28 airports (full names in the airport key): ATL, DFW, ORD, DEN, LAX, SFO, YVR; MEX, BOG; LHR, IST, CDG, AMS, MAD, MUC, HEL; DXB, DOH, RUH; CPT, ADD; SIN, ICN, HND, HKG, PVG, DEL, KUL, drawn from ACI World’s 2025 busiest airports and the Skytrax 2026 top 20, plus two each for Latin America and Africa.
Three research inputs. Claude, Gemini and ChatGPT answered the same research prompts independently, and their answers were compared item by item. Conflicts, single-source statistics and every figure or service used here were then checked at the original source. Inputs returned: Claude 29 statistics and 71 services; ChatGPT 16 and 140; Gemini 37 and 168. Checks found problems in each: a summary tool led Claude to drop a real figure (caught by ChatGPT); ChatGPT ran without the shared brief, so its categories were mapped by hand; Gemini missed the US panel survey, gave a 2017 figure as 2019, cited four Bogotá services to a page that does not mention them, and listed a garden at O’Hare that the cited page does not show. Rows not used in the report were not all checked and remain leads.
Sources. Government and operator counts first, then peer-reviewed studies, industry-body surveys and research firms, with vendor-commissioned surveys labeled and capped at medium, and trade press used to trace results. Searches ran from 22 to 24 October 2026 and were not a systematic review; “none found” means not found, not absent.
Airport key
| Region | Code and airport |
|---|---|
| North America | ATL Hartsfield–Jackson Atlanta International Airport, Atlanta DFW Dallas Fort Worth International Airport, Dallas–Fort Worth ORD O’Hare International Airport, Chicago DEN Denver International Airport, Denver LAX Los Angeles International Airport, Los Angeles SFO San Francisco International Airport, San Francisco YVR Vancouver International Airport, Vancouver |
| Latin America | MEX Mexico City International Airport, Mexico City BOG El Dorado International Airport, Bogotá |
| Europe | LHR Heathrow Airport, London IST Istanbul Airport, Istanbul CDG Paris Charles de Gaulle Airport, Paris AMS Amsterdam Airport Schiphol, Amsterdam MAD Adolfo Suárez Madrid–Barajas Airport, Madrid MUC Munich Airport, Munich HEL Helsinki Airport, Helsinki |
| Middle East | DXB Dubai International Airport, Dubai DOH Hamad International Airport, Doha RUH King Khalid International Airport, Riyadh |
| Africa | CPT Cape Town International Airport, Cape Town ADD Addis Ababa Bole International Airport, Addis Ababa |
| Asia-Pacific | SIN Singapore Changi Airport, Singapore ICN Incheon International Airport, Seoul HND Tokyo Haneda Airport, Tokyo HKG Hong Kong International Airport, Hong Kong PVG Shanghai Pudong International Airport, Shanghai DEL Indira Gandhi International Airport, Delhi KUL Kuala Lumpur International Airport, Kuala Lumpur |
Flags and open questions
- US panel survey. A non-probability panel weighted to the census. Its text says 45% go straight to the gate while its figure shows 37% for that answer and 45% for going to the gate and then backtracking; the figure is used, as in the parent report.
- Dwell-time study. Uses phone-location data that cannot separate time before and after security, and data from 2017–2019, before the pandemic. Its revenue figures are totals per airport; the per-passenger result is the one quoted for shopping.
- Airport-reported dwell. ACI-NA does not define dwell time and the responding airports change between survey years.
- Spend as a proxy. No source counts how many passengers eat or shop; spend per passenger and revenue stand in for both, which mixes price and volume.
- Vendor surveys. Priority Pass, Airport Dimensions and SITA sell lounge access or airport technology; the ACI traveler survey was supported by IDEMIA, NACO and Plaza Premium Group. All are rated no higher than medium. The Asia-Pacific Priority Pass figures come via trade press.
- m1nd-set. The decade figures are reported by trade press; the underlying sample is not published.
- Heathrow. The −21% (against 2019) and +1.7% (2025 on 2024) retail figures use different bases and are both correct.
- Dubai counts. GDRFA reports for “Dubai airports”, not DXB alone.
- Services. Checked on operator or official pages, except SFO, whose site blocked the author’s tools (confirmed by two research inputs and a September 2025 news report), and LAX’s PUP program, whose operator page is undated (confirmed by a May 2025 news report). Pudong’s cabin count is from July 2025.
- Gaps. No observed behavior outside the US, no split of dwell time before and after security, no activity data for Latin America or Africa, and no share of passengers for media, work, reading, sleep or wellness anywhere.
- Scoring. The strength thresholds are the author’s choice; a different cut-off would move several cells.
Change log
- October 2026 edition
- AddedFirst edition, data as of 23 October 2026. Matrix of 16 activity measures by 7 regions (20 of 112 cells measured), and a benchmark of services at 28 airports.
- Changed23 October 2026: airport codes, region tags and acronyms show their full names on hover or tap, and an airport key is added to this section. No findings or figures changed.
- Changed24 October 2026: a third “Continue down the map” card links to Gate Games, a side project made for the wait at the gate. No findings or figures changed.
Related reports on this site
What people do on the move found airports to be the one waiting place with a US activity survey; this report widens that row to the world.[61] One cabin, several people looks at another block of travel time with free hands.
About this report
Personal research by Chuhee Lee. Research, source verification and drafting were carried out with AI models used as a research team: Claude (Anthropic), Gemini (Google) and ChatGPT (OpenAI). Every factual claim is sourced to the references listed below; topic selection, framing, ratings and conclusions are the author’s. These are personal research projects; the views are the author’s own and do not represent any employer or organization. No company named sponsors, reviews or endorses this report, and product names and trademarks belong to their owners. Licensed under CC BY-NC 4.0.
References
- [1] National Academies — Framework and Tools for Incorporating Technologies into Airport In-Terminal Concessions Programs, Appendix B air passenger survey (1,200 panel respondents who flew at least twice in a year, Sep–Oct 2023, weighted to census)research report (non-probability panel) · 2025
- [2] Wu, Y., Morlotti, C. and Mantin, B. — Shopping or dining? On passenger dwell time and non-aeronautical revenues, Journal of Air Transport Management 118, 102620 (89 US airports, Placer.ai location data and FAA revenue reports, 2017–2019)peer-reviewed study (observed data) · 2024
- [3] ACI-NA — Concessions Benchmarking Survey 2025 (79 US and Canadian airports, calendar year 2024, collected Feb–May 2025)industry body (airport-reported data) · Jul 2025
- [4] J.D. Power — 2026 North America Airport Satisfaction Study, release (24,710 surveys of US and Canadian residents, Jul 2025–Jul 2026)survey (research firm) · 16 Sep 2026
- [5] J.D. Power — 2026 U.S. Airport Lounge Satisfaction Study, release (2,991 travelers who visited a US airport lounge in the past year, Apr–Jun 2026)survey (research firm) · 19 Aug 2026
- [6] IATA — Global Passenger Survey 2024, highlights (13,487 respondents)industry body survey · 2024
- [7] IATA — 2025 Global Passenger Survey release (over 10,000 responses from more than 200 countries)industry body survey · 5 Nov 2025
- [8] Priority Pass — research release (commissioned by Priority Pass, fieldwork by Vitreous World; 12,067 travelers in 21 countries and territories, Apr–May 2025)vendor-commissioned survey · 2 Jul 2025
- [9] TTG Asia — Asia-Pacific results of the Priority Pass 2025 surveytrade press (vendor survey) · 8 Jul 2025
- [10] Airport Dimensions (Collinson) — AX26 airport experience research (11,000+ regular travelers in 17 markets; field dates not stated)vendor-commissioned survey · 2026
- [11] ACI World — ASQ Global Traveller Survey, sixth edition, release (4,125 travelers in 30 countries; supported by IDEMIA, NACO and Plaza Premium Group)industry body, sponsored survey · 19 Nov 2025
- [12] SITA — Passenger IT Insights 2025 (7,500 travelers in 25 countries; field dates not stated)vendor survey · 2025
- [13] TRBusiness — m1nd-set reveals decade-long shift in duty free shopping behaviour (m1nd-set B1S tracking, 2016 to H1 2026; sample not stated)trade press (research-firm data) · 24 Aug 2026
- [14] ACI World — Airport non-aeronautical revenues: from traffic recovery to value reinvention (Airport Economics Database, 1,000+ airports, financial year 2024)industry body (financial data) · 17 Mar 2026
- [15] Pragma for the UK Civil Aviation Authority — Heathrow commercial benchmarking, phase 3 report (redacted)regulator-commissioned analysis · 16 May 2026
- [16] Moodie Davitt Report — Heathrow retail revenue and spend growth outpace passenger traffic rise in 2025 (full-year results)trade press (operator results) · 25 Feb 2026
- [17] Moodie Davitt Report — Fraport retail and real estate revenue rises 3% in 2025 but passenger spend weakenstrade press (operator results) · 17 Mar 2026
- [18] Moodie Davitt Report — Groupe ADP posts double-digit rise in retail revenue but average spend slips in 2025trade press (operator results) · 19 Feb 2026
- [19] ACI Asia-Pacific & Middle East — Travel Retail in the Post-Pandemic Era (c.4,000 passenger responses, 21 countries, mid-Oct 2025 to mid-Jan 2026)industry body study · Feb 2026
- [20] Dubai Media Office — Dubai Duty Free annual sales 2025government media office (operator results) · 1 Jan 2026
- [21] Gulf News — Dubai smart gates process 9.4 million travellers in 6 months (GDRFA Dubai figures, Jan–Jun 2026)news (government data) · 6 Jul 2026
- [22] Press Information Bureau, Government of India — Digi Yatra crosses 10 crore usage across 38 airportsgovernment release · 30 May 2026
- [23] Jewel Changi Airport — Jewel reports record high footfall and sales (calendar year 2024)operator release · 27 Jan 2025
- [24] Aena — More than 30,400 children used the play areas at Madrid-Barajas in 2019operator release · 22 Jan 2020
- [25] Meet in Shanghai — New stops added to free layover tours (Trip.com participant figure since 15 Apr 2024)city tourism portal · 18 Sep 2024
- [26] New York Times — As amenities sit unused, airports reconsider their design (18 Aug 2020), as syndicated on the Star Alliance portalnews · Aug 2020
- [27] Changi Airport — Butterfly Gardenoperator page · checked 23 Oct 2026
- [28] Changi Airport — Free Singapore Touroperator page · checked 23 Oct 2026
- [29] Qatar News Agency — HIA launches Vitality and Wellness Studio in The Orchard (with ORCHARD size); listings confirmed on dohahamadairport.com/relaxstate news agency · 9 Sep 2026
- [30] Amsterdam Airport Schiphol — Special places at Schipholoperator page · checked 23 Oct 2026
- [31] KLM — Security time slot at Schiphol (free booking up to three days ahead)airline page · checked 24 Oct 2026
- [32] Vancouver International Airport — The best spots to relax at YVRoperator news · 30 Apr 2026
- [33] Vancouver International Airport — Quiet spacesoperator page · checked 24 Oct 2026
- [34] Malaysia Airports — launch of RIMBA at KLIA Terminal 1operator release · 13 Jan 2026
- [35] Unidivers — Paris-Rome at Espace Musées, Paris-Charles de Gaulle (18 Jun 2026 to 5 Jan 2027)arts press · 3 Jun 2026
- [36] YOTEL — YOTELAIR Paris Charles de Gaulle Airportoperator page · checked 23 Oct 2026
- [37] Incheon International Airport — Traditional Korean Culture Experience Centeroperator page · checked 23 Oct 2026
- [38] Incheon International Airport — Transit touroperator page · checked 24 Oct 2026
- [39] iGA Istanbul Airport — iGA Sleepodoperator page · checked 24 Oct 2026
- [40] Turkish Airlines — Stopover and Touristanbulairline page · checked 23 Oct 2026
- [41] Shanghai Municipal Government (China Daily) — Pudong airport rest cabins and free showersgovernment portal · 10 Jul 2025
- [42] Trip.com — Shanghai free layover touroperator page · 3 Aug 2026
- [43] Hong Kong International Airport — Free layover touroperator page · checked 24 Oct 2026
- [44] Hong Kong International Airport — Sensory Corner (opened 1 April 2026)operator page · checked 23 Oct 2026
- [45] Aena — Madrid-Barajas starts its Christmas operation with new passenger servicesoperator release · 19 Dec 2025
- [46] Aena — Air Rooms, Madrid-Barajasoperator page · checked 24 Oct 2026
- [47] Ethiopian Airlines — Addis Ababa stopovers (free transit hotel; Skylight In-Terminal Hotel)airline page · checked 23 Oct 2026
- [48] El Dorado International Airport — Rest rooms (Wait n' Rest, Sleep Oasis)operator page · checked 23 Oct 2026
- [49] Finavia — Relax and enjoy at Helsinki Airport (updated 24 Sep 2026)operator page · checked 24 Oct 2026
- [50] Finavia — New quiet room opened at Helsinki Airportoperator release · Nov 2025
- [51] Heathrow — Non-visible disabilities supportoperator page · checked 23 Oct 2026
- [52] Heathrow — Reserve & Collectoperator page · checked 23 Oct 2026
- [53] Axios San Francisco — Finding SFO's hidden gems (yoga rooms, sensory room, Wag Brigade, SkyTerrace)news · 26 Sep 2025
- [54] Denver International Airport — Canine Airport Therapy Squad (CATS)operator page · modified 13 Oct 2026
- [55] Denver International Airport — DEN's outdoor decksoperator page · Oct 2026
- [56] Los Angeles World Airports — Pets Unstressing Passengers (PUP) programoperator page · undated
- [57] Spectrum News 1 — LAX PUP programnews · 22 May 2025
- [58] Munich Airport — Airbräuoperator page · checked 24 Oct 2026
- [59] Munich Airport — Christmas and Winter Market 2026operator page · checked 23 Oct 2026
- [60] Dubai Airports — Game Space gaming loungeoperator page · checked 24 Oct 2026
- [61] Chuhee Lee — What people do on the move, October 2026 edition (this site)own report · 21 Oct 2026