Chuhee Lee

Seven forces, one picture
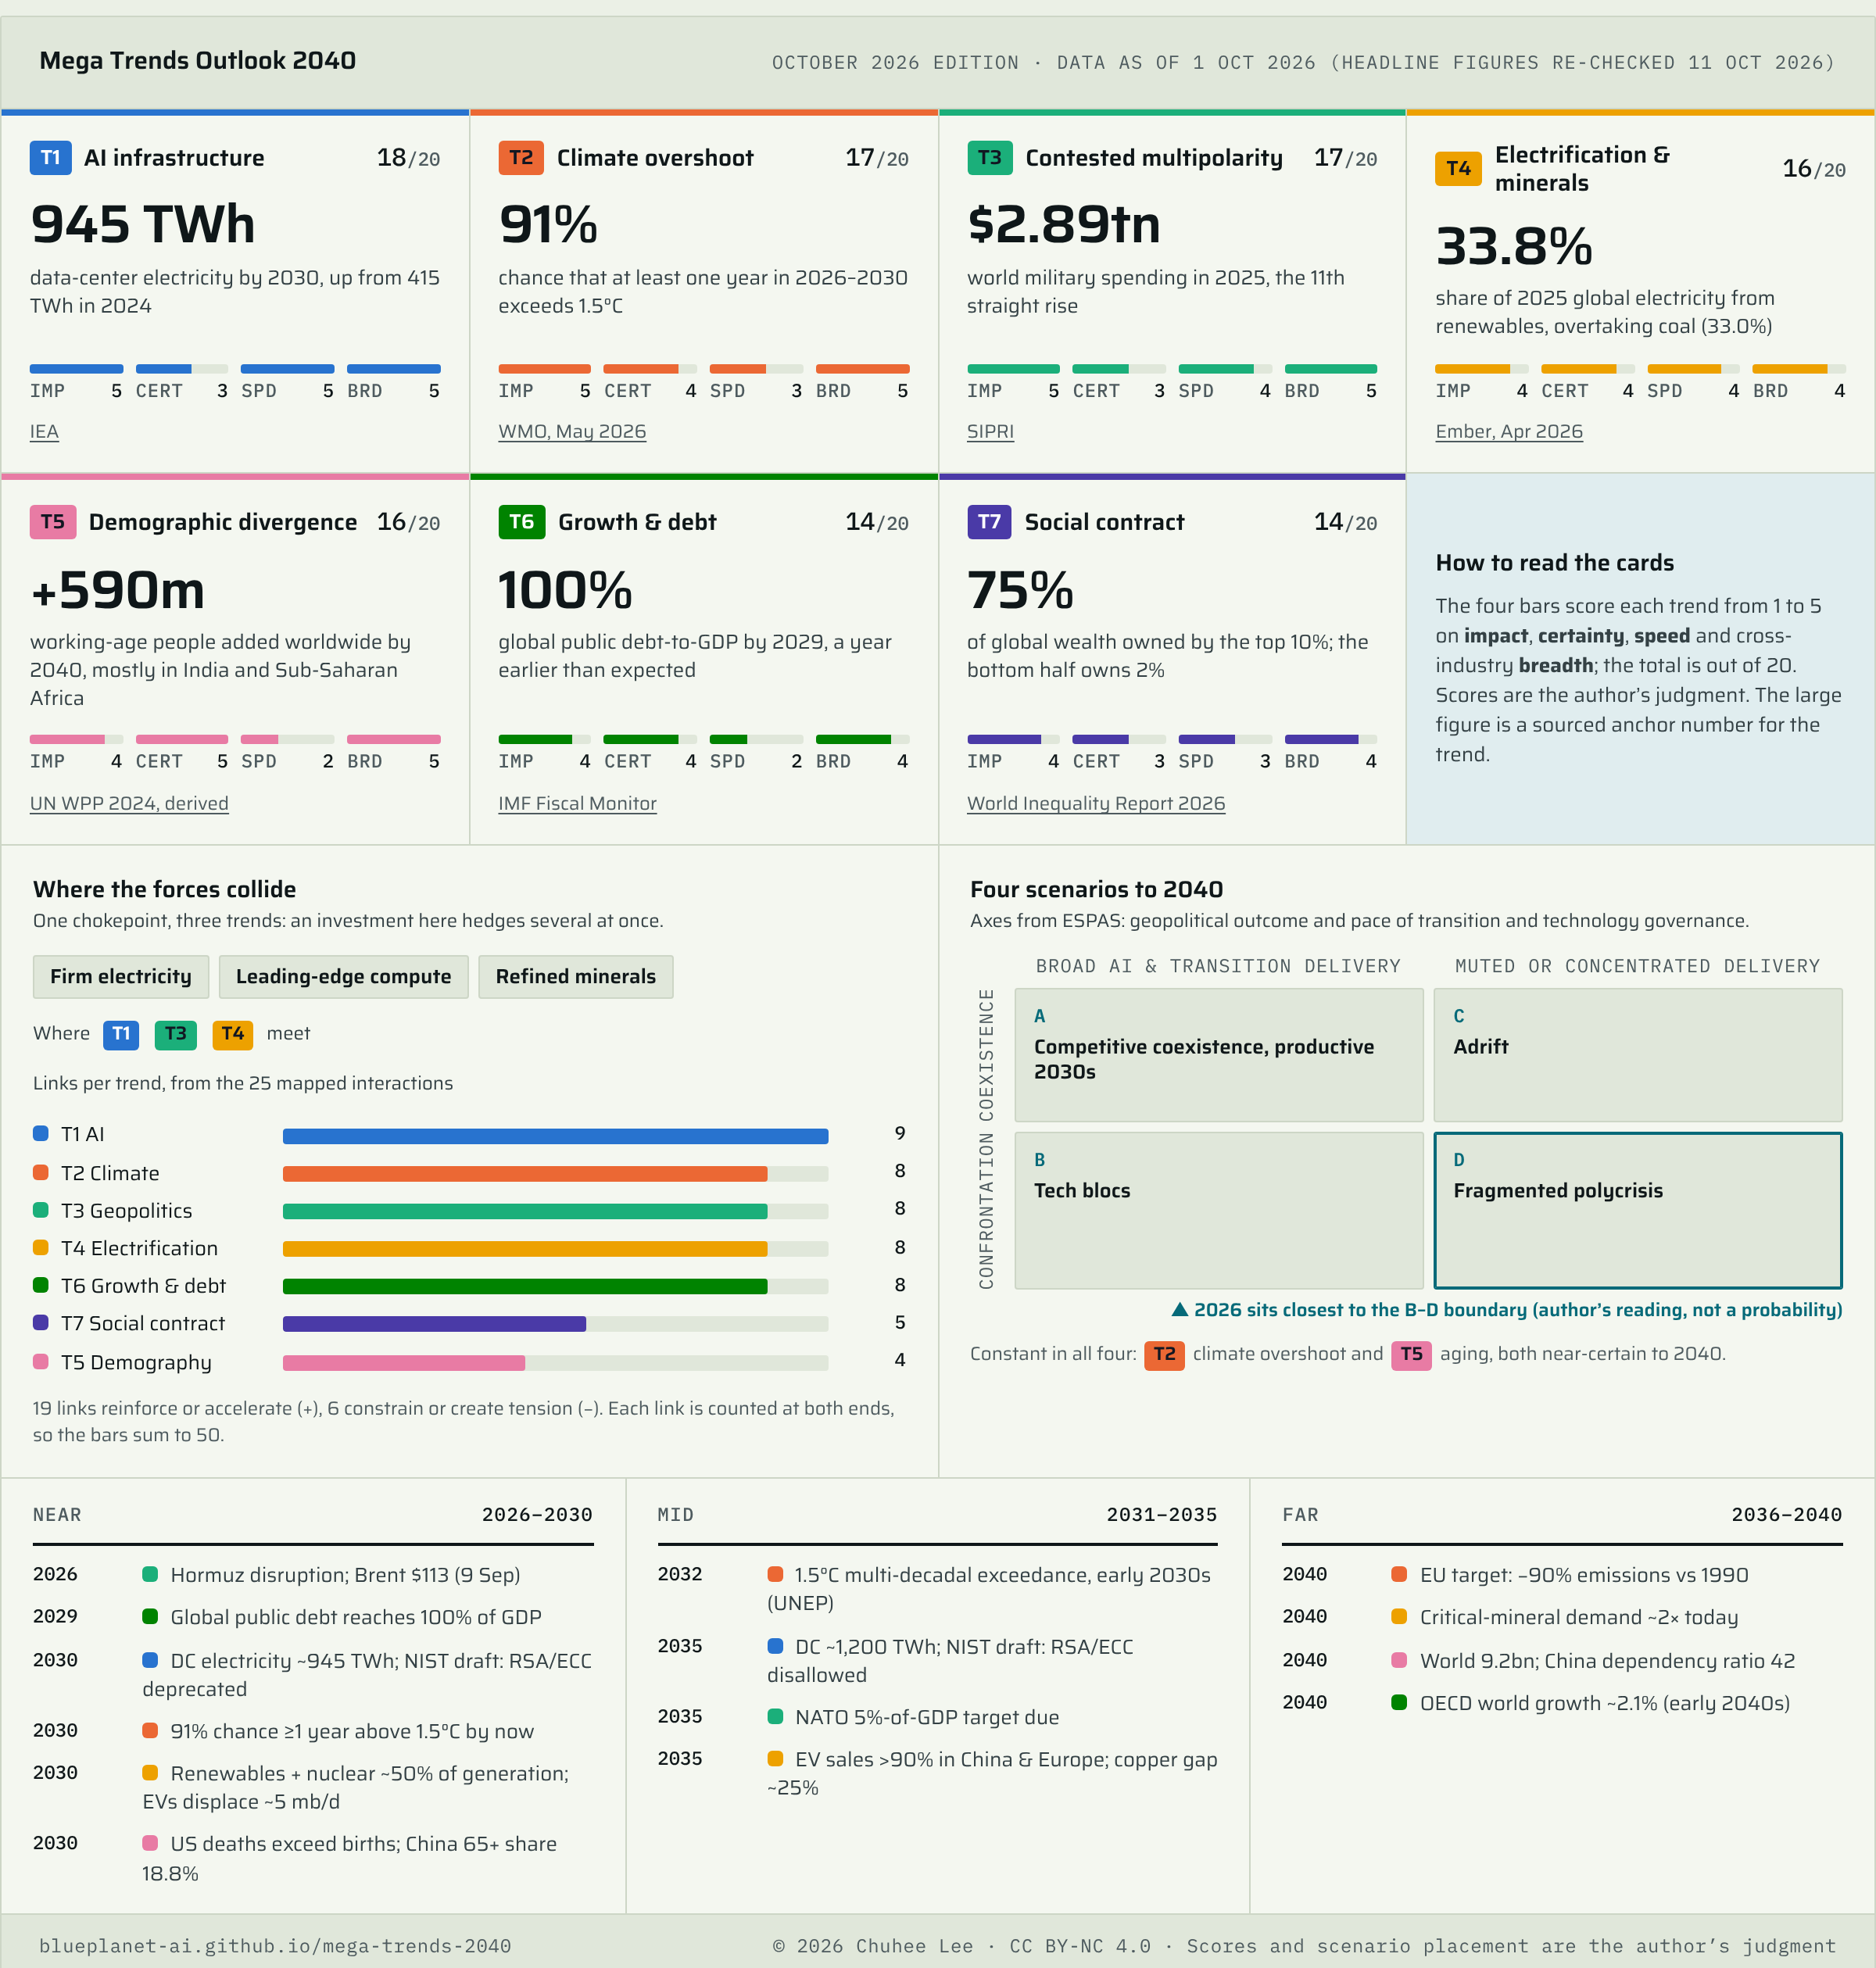
Scores, anchor figures, collisions, scenario space and dated milestones on one page. Everything here is drawn from the data in the sections below; follow the links for sources and method.
Headline findingThe trends are agreed. Their certainty is not.
The trends are agreed. Their certainty is not.
Every cross-domain foresight list verified for this report names technology, demographics, geopolitics and inequality, and every list that itemises climate names it too. The trends differ most in how certain they are. Demographics are close to locked in. AI is the fastest and broadest force but the least certain in payoff. The strategic risk lies less in any single trend than in how they collide: AI load hits the grid, aging, defense and debt squeeze the same budgets, and rivalry runs through chips and minerals. The 2026 closure of the Strait of Hormuz has already shown a fast trigger cascading through slow stresses.
Demographics are the anchor
The world adds about 590 million working-age people by 2040, and India plus Sub-Saharan Africa supply about 84% of them. China loses about 132 million, the EU about 31 million. Everyone of working age in 2040 is already born.
AI is physical, and power-bound
Data-center electricity more than doubles to about 945 TWh by 2030. Published GDP-impact estimates range from about +1% to +7% over a decade, so build for the capex certainty and hedge the payoff uncertainty.
One chokepoint, three trends
Firm electricity, leading-edge compute and refined minerals sit where AI, geopolitics and electrification collide. An investment there hedges several trends at once.
Plans will be wrong on timing
Forecasters underestimated AI and overestimated hydrogen. Pair robust commitments with options triggered by signposts, and re-score the trends every year.
Convergence first, then four-criteria scoring
The shortlist starts from five verified cross-domain foresight lists, then adds the WEF Global Risks 2026 survey of 1,300+ leaders as a risk-based cross-check. Each candidate is scored 1–5 on impact, certainty, speed and breadth. Health, work, space, quantum and cybersecurity were assessed but fold into the seven rather than standing alone.
What each score measures. Impact is how large the effect is on economies and organizations. Certainty is how confident we can be in its direction and magnitude by 2040. Speed is how fast the change unfolds within the 2026–2040 window. Breadth is how many sectors it touches. Each is scored from 1 (lowest) to 5 (highest). The scores are the author’s analytical judgment from the cited evidence, not sourced figures, and the four criteria were set for this report rather than taken from a validated method in the literature.
Which themes do the foresight lists share?
Researchers' tallyLists: PwC (Nov 2025), EU JRC (Nov 2025), ESPAS (Apr 2024), Roland Berger (2023), EY (2026). Tally compiled 1 Oct 2026; not a published figure.
WEF Global Risks 2026: top five
Re-checkedAI outcomes jumped from #30 to #5 on the ten-year list; inequality was rated the most interconnected risk for the second year. Source: WEF Global Risks Report 2026, 14 Jan 2026.
Scoring matrix
Analytical judgmentCriteria set by the author; the only literature anchor is Naughtin et al.'s consensus definition of a megatrend (Futures, 2024).
Impact vs certainty (bubble size = speed)
Analytical judgmentPoints with equal scores are nudged apart so labels stay readable. Top-right: build into the base plan. Top-left: hedge with options.
Collisions matter more than any single trend
Lawrence, Homer-Dixon and colleagues describe a polycrisis as crises in several systems that become causally entangled when slow stresses meet fast triggers (Global Sustainability, 2024). The map below shows 25 directed links between the seven trends. Mapping the trends onto that model is the author’s interpretation; the sourced or inferred basis of each link is in the table.
AI-power loop
AI demand pulls electrification forward, grid limits throttle AI, and both nudge emissions. Whoever holds firm power and grid capacity captures the AI value.
Rivalry-resource loop
Geopolitics both blocks the transition (mineral and chip controls) and speeds it up (energy security), while mineral concentration feeds back into rivalry.
Fiscal squeeze
Aging, defense, climate damage and interest costs converge on budgets heading toward 100% debt-to-GDP, with inequality as the channel into politics.
Show all 25 links as a table
Dated milestones, 2026 to 2040
Each dot is a dated target, deadline or projection from the cited sources. Hover a dot for detail; the ledger below lists them by year. Most sourced milestones cluster before 2035; outside demographics and minerals, few sources quantify 2040.
Outlook by horizon
Four scenarios bracket the 2040 strategy space
The two axes come from ESPAS’s critical uncertainties (geopolitical outcomes; pace of transition and technology governance). Quadrants are mapped to the US NIC Global Trends 2040 scenarios (Mar 2021; the series was discontinued in Sep 2025) and the UK MoD Global Strategic Trends 7 (Oct 2024), now the most recent major official set. Quadrant names and the 2026 marker are the author’s framing.
Competitive coexistence, productive 2030s
Truces harden into rules. AI reaches the World Bank’s optimistic case, the most prosperous decade since the 1970s.
Adrift
No great-power war, but growth trends toward the OECD’s ~2.1% early-2040s path. The AI payoff lands at the low end (Acemoglu, PWBM), and debt and aging dominate.
Tech blocs
Rival AI and compute stacks, chip and mineral blocs, high defense spending. Strong AI gains stay inside blocs.
Fragmented polycrisis
Chokepoint wars, export controls and debt stress compound. Fragmentation costs move toward the IMF’s upper range (~7% of output), with growth near the IMF severe case (~2%). The exit route is a shock-driven pivot to NIC Tragedy and Mobilization.
Signposts: geopolitical order (axis 1)
- US-China trade arrangements at the APEC and G20 leader meetings in late 2026
- Whether the new AI dialogue produces binding commitments
- Hormuz flows recovering in 2027
- NPT or arms-control talks after New START expired (Feb 2026)
Signposts: transition delivery (axis 2)
- Measured productivity: the gap between expected (1.4%) and realized (0.29%) AI gains
- Data-center completions versus grid-connection queues
- The semiconductor cycle after 2027
- Copper and rare-earth refining capacity outside China
The 2026 position is the author’s reading of the evidence (an active chokepoint war, monetized export controls, AI investment outpacing measured returns), not a probability. Sources: ESPAS; NIC GT2040; UK MoD GST7 (scenario labels paraphrased).
Low-probability, high-impact discontinuities
Every probability shown is a published estimate from the named source or is marked as the author’s arithmetic. None is a forecast made for this report. Where no probability exists, the card says so.
Pandemic: 2%/yr compounds over 15 years
Author arithmeticAnnual rate for a COVID-scale pandemic of about 2% from Marani et al., PNAS 2021. Cumulative curve = 1 − 0.98n, assuming a constant rate; the authors say the rate may rise.
Taiwan: no published probability, large cost estimates
Secondary / datedBloomberg Economics (Jan 2024, via secondary summary); Rhodium Group (Dec 2022). CSIS wargames (2023): invasion usually fails at very high cost.
Robust commitments, plus options that switch on with the signposts
Robust in all four scenarios
Commit- Electrify where cost curves already win; lock in grid connections and long-term power contracts early.
- Automate for shrinking workforces in East Asia and Europe; retain older workers.
- Build climate resilience against today’s ~1.5°C baseline, not historical averages; expect insurance to drive siting.
- Post-quantum readiness against the 2030 deprecation and 2035 disallowance of RSA/ECC proposed in NIST’s draft guidance (IR 8547).
- Growth exposure to India, ASEAN and selected African markets.
- Trust and provenance by default in content and communications.
Options, triggered by signposts
Hedge- Regionalized supply chains: dual sourcing for leading-edge chips and rare-earth magnets.
- AI-scale bets, staged against measured productivity rather than adoption.
- A fallback footprint for the fragmented quadrants (B and D).
- Divergent oil scenarios rather than a single peak date.
- Magnet-free motors and alternative chemistries (LFP, sodium-ion) as mineral hedges.
- Annual re-scoring that aggregates several institutional views instead of trusting one.
Implications for the automotive and mobility sector
Observations for the sector as a whole, not advice to any company. Points marked “inference” are the author’s reading, not sourced projections.
Long-range forecasts deserve humility
Megatrend studies rarely show their working
267 studies, 1982–2022Naughtin et al., Futures 157, Mar 2024. Trend counts ranged from 1 to 25; seven trends over 15 years is within the norm, but it is a design choice.
Experts underestimated AI progress
FRI, Sep 2025Average probability assigned in a 2022 tournament to AI benchmark outcomes that did occur by mid-2025, and to an AI winning IMO gold by 2025 (it did in Jul 2025). The same forecasters were over-optimistic on hydrogen costs (forecast $3.50–4.50/kg vs ~$7.50 actual). Forecasting Research Institute.
How this report applies those lessons
Anchor on the most reliable numbers. Demographics lead; individual forecasters did no better than “no change” baselines.
Show ranges from several institutions for AI GDP effects, oil demand and fragmentation costs. Aggregation improved accuracy by about 1 standard deviation.
Treat technology timing as low-confidence in both directions, since forecasters were too slow on AI and too fast on hydrogen.
Keep scores explicitly judgmental, and spot-check figures read through summaries against the primary PDFs before external use.
What was checked, and what to keep in mind
Seventeen headline figures were re-tested against the official source pages in two independent passes (1 and 11 October 2026). All seventeen are confirmed; one source attribution was corrected (McKinsey’s adoption figures come from its State of AI survey) and two phrasings were tightened (Swiss Re’s insured share; IEA’s export-control exposure).
Known limitations
- Data vintage. Figures are as of 1 October 2026. Growth and debt use the IMF’s April 2026 projections; the July 2026 WEO Update lowered 2026 global growth to 3.0% and raised 2027 to 3.4%. The October 2026 WEO will be reflected in the next edition.
- Judgment, labeled. Trend scores, quadrant names, the 2026 scenario marker and items marked “inference” are the author’s judgment. Figures marked “derived” are arithmetic on sourced numbers.
- Secondary sources. Some figures come via secondary summaries where the primary page could not be retrieved; each is marked where used. Several anchors are dated (for example Rhodium 2022, Goldman Sachs 2023, NIC 2021).
- Thin far horizon. Outside demographics, AI energy demand, critical minerals and long-run growth, few sources quantify 2036–2040.
- Policy statements. Claims about laws, regulations and government policy cite official texts. Details of national AI laws are omitted because no official source was retrieved for them.
- No probabilities invented. Where no published probability exists (for example a Taiwan conflict), the report shows cost estimates or rankings instead.
About this report
Author. Chuhee Lee. This is an independent, personal research project. The views and assessments are the author’s own and do not represent those of any employer or organization.
Independence. No organization named here sponsored, reviewed or endorsed this report. Names and trademarks belong to their respective owners.
Research assistance. Research, source verification and drafting were carried out with several AI models, including Claude (Anthropic), Gemini (Google) and ChatGPT (OpenAI). Every factual claim is sourced to the references below; trend selection, scores and conclusions are the author’s judgment.
Update schedule. The outlook is refreshed at least once a year. The next scheduled refresh is in October 2027; every change is recorded in the change log below.
License. © 2026 Chuhee Lee. Licensed under Creative Commons Attribution-NonCommercial 4.0 International (CC BY-NC 4.0). You may share and adapt this work for non-commercial purposes with appropriate credit, a link to the license, and an indication of any changes.
Suggested citation. Chuhee Lee, Mega Trends Outlook 2040, October 2026 edition (data as of 1 October 2026), https://blueplanet-ai.github.io/mega-trends-2040/, CC BY-NC 4.0.
Corrections. Spotted an error or a newer source? Please get in touch via LinkedIn.
Change log
- 18 October 2026
- ClarifiedCaptions and chart notes that referred to working notes now say “sources reviewed”. No scores, figures or conclusions changed.
- 13 October 2026
- ClarifiedSection 02 now defines what each of the four scoring criteria (impact, certainty, speed, breadth) measures. No scores, figures or conclusions changed.
- October 2026 edition — first public release
- PublishedData as of 1 October 2026. Seven mega trends scored on impact, certainty, speed and breadth, with horizon outlooks, a 25-link interaction map, a dated milestone roadmap, four scenarios, wildcards and 130 references.
- VerifiedSeventeen headline figures re-checked against official sources on 1 and 11 October 2026; McKinsey adoption figures re-attributed to its State of AI survey (August 2026); Swiss Re and IEA wording tightened.
References
Dates are publication or as-of dates. “Secondary” marks a source that reports another organization’s figures. Official and primary domains were preferred throughout.
130 numbered references
Foresight lists, risk reports and methods
- PwC, “Megatrends: Five global shifts reshaping the world we live in,” Nov 2025. pwc.com
- McKinsey, “The state of AI in 2026: On the road to ROI,” 25 Aug 2026 (source of the AI adoption and EBIT figures): mckinsey.com ; and “Technology Trends Outlook 2026,” 15 Sep 2026. Landing page: mckinsey.com ; PDF: mckinsey.com
- Gartner, “Top Strategic Technology Trends for 2026,” 20 Oct 2025. gartner.com
- EY, “Megatrends 2026 and beyond,” 2026 (date unconfirmed). ey.com
- EU JRC, Megatrends Hub, updated 10 Nov 2025. knowledge4policy.ec.europa.eu
- ESPAS, “Global Trends to 2040: Choosing Europe’s Future,” Apr 2024. espas.eu
- Roland Berger, Trend Compendium 2050, 2023 edition. rolandberger.com
- Zukunftsinstitut, Megatrend-Map, 12 Mar 2024. zukunftsinstitut.de
- WEF, Global Risks Report 2026, 14 Jan 2026 (updated 12 May 2026). weforum.org ; key findings: weforum.org ; PDF: reports.weforum.org
- US NIC, “Global Trends 2040: Scenarios,” Mar 2021. archive.dni.gov
- Hawaii Tribune-Herald (NYT wire), “Gabbard ends intelligence report on future threats,” 27 Sep 2025. hawaiitribune-herald.com
- UK MoD DCDC, “Global Strategic Trends 7: Out to 2055,” Oct 2024. assets.publishing.service.gov.uk ; bite-size: assets.publishing.service.gov.uk
- Naughtin et al., “Forty years in the making: A systematic review of the megatrends literature,” Futures 157, Mar 2024. sciencedirect.com
- Lawrence, Homer-Dixon et al., “Global polycrisis: the causal mechanisms of crisis entanglement,” Global Sustainability 7, Jan 2024. cambridge.org
- Forecasting Research Institute, near-term XPT accuracy, 2 Sep 2025. forecastingresearch.org ; Substack commentary: forecastingresearch.substack.com
- Karger et al., Existential-Risk Persuasion Tournament, FRI, Jul-Aug 2023. forecastingresearch.org
- L. Muehlhauser, “How Feasible Is Long-range Forecasting?”, 10 Oct 2019. coefficientgiving.org
- H. Karnofsky, “The Track Record of Futurists Seems ... Fine,” Cold Takes, 30 Jun 2022. cold-takes.com
- Apreda et al., “Expert forecast and realized outcomes in technology foresight,” TFSC 141, 2019. ideas.repec.org
- Eurasia Group, Top Risks 2026, 5 Jan 2026. eurasiagroup.net
- Chatham House, “The world in 2026,” 15 Dec 2025 (updated 5 Jan 2026). chathamhouse.org
Demographics, health and society
- UN DESA, World Population Prospects 2024: Summary of Results, 11 Jul 2024. population.un.org
- UN Population Division, wpp2024 R data package v1.1-3, 26 Nov 2024 (source for computed tables). github.com
- UN DESA, E/CN.9/2026/CRP.1 (WPP 2026 postponed), 26 Mar 2026. un.org
- UN DESA, World Population Highlights 2026: Youth, 27 Feb 2026. un.org
- US Census Bureau, “An Aging World,” Sep 2026. census.gov
- IHME/GBD fertility forecast, The Lancet, 20 Mar 2024. thelancet.com
- ABC News (reporting NBS), China population decline, 20 Jan 2026 (secondary). abc.net.au
- Al Jazeera (reporting SRS), India fertility below replacement, 9 Jun 2026 (secondary). aljazeera.com
- Eurostat, Population projections in the EU (EUROPOP2025), Apr 2026. ec.europa.eu
- CBO, Demographic Outlook 2026-2056, Jan 2026. cbo.gov
- Pension Policy International (reporting MHLW), Japan births 2025, 2026 (secondary). pensionpolicyinternational.com
- ISVD, Japan birthrate 2025, 2026 (secondary). isvd.or.jp
- Korea Times (reporting Statistics Korea), 26 Aug 2026 (secondary). koreatimes.co.kr ; Korea.net: korea.net
- UN DESA, World Urbanization Prospects 2025, 18 Nov 2025. un.org
- ILO, Employment and Social Trends, May 2026 update. ilo.org
- WHO, Noncommunicable diseases fact sheet, 25 Sep 2025. who.int
- WHO, GLP-1 obesity guideline, 1 Dec 2025. who.int
- WHO, mental health conditions, 2 Sep 2025. who.int
- GBD AMR collaborators, The Lancet, 16 Sep 2024. thelancet.com
- WEF, Future of Jobs Report 2025, Jan 2025. weforum.org
- IMF, SDN/2026/001 “New Jobs Creation in the AI Age,” 2026. imf.org
- Edelman, 2026 Trust Barometer (fieldwork Oct-Nov 2025). edelman.com
- World Inequality Lab, World Inequality Report 2026, ~Dec 2025. wir2026.wid.world
- World Bank, Poverty, Prosperity, and Planet Report 2024, Oct 2024. worldbank.org
- V-Dem Institute, Democracy Report 2026, 17 Mar 2026. v-dem.net
- Freedom House, Freedom in the World 2026, Mar 2026. freedomhouse.org
Economy and finance
- IMF, World Economic Outlook Apr 2026, Ch. 1. imf.org
- IMF blog, “War darkens global economic outlook,” 14 Apr 2026. imf.org
- IMF, Fiscal Monitor, 15 Apr 2026. imf.org
- World Bank, Global Economic Prospects, Jun 2026. thedocs.worldbank.org
- OECD, Economic Outlook Interim Report, Sep 2026. oecd.org
- OECD Ecoscope, long-run scenarios 2025 update, 8 Sep 2025. oecdecoscope.blog
- OECD Ecoscope, fiscal impact of population aging, 7 Nov 2025. oecdecoscope.blog
- ECB Economic Bulletin 5/2024 box on the 2024 Ageing Report. ecb.europa.eu
- Goldman Sachs, “The Path to 2075,” 8 Dec 2022. goldmansachs.com
- NBER WP 34836 (firm AI survey), Feb 2026. nber.org
- IMF COFER Data Brief, Q1 2026. data.imf.org
- FRBSF Economic Letter 2026-26, stablecoins and Treasuries, 28 Sep 2026. frbsf.org
- BIS, Annual Economic Report press release, 23 Jun 2026. bis.org
- UNCTAD, Global Trade Update, Jan 2026. unctad.org
- Global Trade Magazine (reporting WTO forecast), 23 Mar 2026 (secondary). globaltrademag.com
- Goldman Sachs, global AI investment, 7 Aug 2026. goldmansachs.com
- Brookings (Fengler, Kharas et al.), consumer class 4bn to 5bn, 25 Jul 2023. brookings.edu
- CNBC (reporting IMF SDN on fragmentation), 16 Jan 2023 (secondary). cnbc.com
- Market Business News (reporting WTO World Trade Report 2026), Sep 2026 (secondary). marketbusinessnews.com
Climate, energy and minerals
- Copernicus C3S, 2025 third-hottest year, 14 Jan 2026. climate.copernicus.eu
- WMO, State of the climate release, 23 Mar 2026. wmo.int
- WMO, Global Annual to Decadal Climate Update 2026-2035, 28 May 2026. wmo.int
- Global Carbon Budget 2025, 13 Nov 2025. globalcarbonbudget.org
- UNEP, Emissions Gap Report 2025 press release, 4 Nov 2025. unep.org
- Swiss Re Institute, sigma 1/2026, 18 Mar 2026. swissre.com
- Artemis (reporting Swiss Re), 92% secondary perils, 2026 (secondary). artemis.bm
- University of Frankfurt (summary of Global Tipping Points Report 2025), Oct 2025 (secondary). aktuelles.uni-frankfurt.de
- Global Challenges Foundation (summary of Global Tipping Points Report 2025), Oct 2025 (secondary). globalchallenges.org
- PIK, seven of nine planetary boundaries breached, 24 Sep 2025. pik-potsdam.de
- UNFCCC, Decision 1/CMA.7 “Global Mutirão” (FCCC/PA/CMA/2025/19/Add.1), COP30, Nov 2025 (document dated 30 Mar 2026). unfccc.int ; UNEP, Adaptation Gap Report 2025 “Running on Empty”, Oct 2025: unep.org
- Ministry of Foreign Affairs of the PRC, Xi Jinping remarks to the UN Climate Summit (2035 NDC targets), 24 Sep 2025. mfa.gov.cn ; UNFCCC NDC registry, China’s 2035 NDC, submitted 3 Nov 2025: unfccc.int
- US EPA, press release on the endangerment-finding rescission, 12 Feb 2026. epa.gov ; Federal Register final rule 91 FR 7686, 18 Feb 2026: federalregister.gov
- Regulation (EU) 2026/667 amending the European Climate Law (2040 target), signed 11 Mar 2026, in force 7 Apr 2026. eur-lex.europa.eu ; adopted text PE-CONS 5/1/26 REV 1: data.consilium.europa.eu
- FAO, SOFI 2026, 21 Jul 2026. fao.org
- Ember, Global Electricity Review 2026, 21 Apr 2026. ember-energy.org
- IEA, World Energy Outlook 2025 (executive summary, overview), Nov 2025. iea.org ; iea.org
- IEA, Global EV Outlook 2026, 2026. iea.org ; news: iea.org
- IEA, Electricity 2026, 2026. iea.org
- IEA, Energy and AI, 2025. iea.org
- IEA, data-center electricity news, 16 Apr 2026. iea.org
- IEA, World Energy Investment 2026, 28 May 2026. iea.org
- IEA, Oil Market Report, Sep 2026. iea.org
- OPEC, World Oil Outlook 2026 press release, 18 Jun 2026. opec.org
- World Nuclear Association, World Nuclear Outlook 2026, 6 Sep 2026. world-nuclear.org
- IEA, Global Critical Minerals Outlook 2026. iea.org ; news release: iea.org
- USGS, Mineral Commodity Summaries 2026: Lithium. pubs.usgs.gov
- Energy-Storage.News (reporting BNEF Battery Price Survey), Dec 2025 (secondary). energy-storage.news
Technology
- METR, Time Horizon 1.1, 29 Jan 2026. metr.org
- UNU-CCC summary of Stanford AI Index 2026, Apr 2026 (secondary). c3.unu.edu
- Yield Theory, hyperscaler AI capex tracker, Jul 2026 (secondary). yieldtheory.app
- Forbes, central banks and the AI bubble debate, 8 Jul 2026 (secondary). forbes.com
- SIA, 2025 semiconductor sales, 6 Feb 2026. semiconductors.org
- WSTS, Spring 2026 forecast, May 2026. wsts.org
- Taipei Times (reporting TrendForce foundry shares), 10 Sep 2026 (secondary). taipeitimes.com
- Taipei Times, TSMC 2nm capacity, 29 Apr 2026. taipeitimes.com
- US Bureau of Industry and Security, “Revision to License Review Policy for Advanced Computing Commodities,” 91 FR 1684, 15 Jan 2026. govinfo.gov ; White House fact sheet on the 25% tariff on certain advanced computing chips, 14 Jan 2026: whitehouse.gov
- Epoch AI, “Can AI scaling continue through 2030?”, Aug 2024. epoch.ai
- IFR, World Robotics 2025 press release, Sep 2025. ifr.org
- Baidu, Q1 2026 results. ir.baidu.com
- Automotive World, Waymo 1M weekly rides target, 2026 (secondary). automotiveworld.com
- TrendForce, China humanoid robots, 9 Apr 2026. trendforce.com
- NIST IR 8547 (initial public draft), 12 Nov 2024. nvlpubs.nist.gov
- Acemoglu, “The Simple Macroeconomics of AI,” NBER WP 32487, May 2024. nber.org
- Penn Wharton Budget Model, projected impact of gen AI, 8 Sep 2025. budgetmodel.wharton.upenn.edu
- IMF WP/25/76, “The Global Impact of AI: Mind the Gap,” Apr 2025. imf.org
- Goldman Sachs, gen AI could raise global GDP by 7%, 5 Apr 2023. goldmansachs.com
- McKinsey Global Institute, economic potential of generative AI, 14 Jun 2023. mckinsey.com
- Space Foundation, Global Space Economy report, Jul 2026. spacefoundation.org
- WEF/McKinsey, “Space: The $1.8 Trillion Opportunity,” 8 Apr 2024. weforum.org
- FBI IC3, 2025 Internet Crime Report, 2026. ic3.gov
Geopolitics and security
- SIPRI, military expenditure 2025 press release, 27 Apr 2026. sipri.org ; Yearbook 2026 ch.5: sipri.org ; NATO Hague Summit Declaration, 25 Jun 2025: ncia.nato.int
- Defence-Industry.eu (reporting SIPRI Yearbook 2026 nuclear data), Jun 2026 (secondary). defence-industry.eu ; Russian MFA statement on New START expiry, UN document CD/2500, 4 Feb 2026: docs-library.unoda.org ; UN, NPT Review Conference closing, 22 May 2026: media.un.org
- UK House of Commons Library, CBP-10636 (Iran conflict and Hormuz), as of 4 Sep 2026. commonslibrary.parliament.uk
- Ministry of Foreign Affairs of the PRC, readout of the Xi-Trump talks in Washington (Spanish), 25 Sep 2026. mfa.gov.cn
- Christian Science Monitor, Russia-Ukraine talks, 26 Sep 2026. csmonitor.com
- UN Global Dialogue on AI Governance, co-chairs' summary, Sep 2026. un.org
- USNI News, Justice Mission 2025, 31 Dec 2025. news.usni.org
- Rhodium Group, “Taiwan economic disruptions,” 14 Dec 2022. rhg.com
- Edward Conard summary of Bloomberg Economics Taiwan-war estimate, Jan 2024 (secondary). edwardconard.com
- Taipei Times (reporting GMF), 7 Jan 2026 (secondary). taipeitimes.com
- CSIS, “The First Battle of the Next War,” 9 Jan 2023. csis.org
- NewSpace Economy (reporting ESA Space Environment Report 2026), 14 Sep 2026 (secondary). newspaceeconomy.ca
- Marani et al., “Intensity and frequency of extreme novel epidemics,” PNAS, Aug 2021. pnas.org